Saturday, February 23, 2013

Clipperton Island FR - It Has Been a Long Time Between Maps and Why.

Clipperton Island - DigitalGlobe from Google Earth 
Clipperton Island - DigitalGlobe Image taken from Google Earth

Clipperton Island - EEVS Map (1-17030) 
Clipperton Island - EEVS Precision Map (1:17030)

Taking advantage of DigitalGlobes hi-res imagery found in Google Earth, I was able to redo my original EVS precision map of Clipperton Island into an EEVS (Extremely Enhanced Vector Shoreline) precision map.  Clipperton remains a popular, but long-distant fishing destination for long range boats from San Diego, my home town.  It is also one of the only French possessions located in the Pacific Ocean.  Besides the fishermen, DX'ers love to transmit and receive QSL's from this remote atoll.

I have been a busy map maker these past four months. My day job, as many of you know, is a middle school teacher. That means that every weekday I attempt to teach meaningful Social Studies lessons to a room full of less-than-eager students. This year I am trying something different, I teach Social Studies lessons using both Google Earth and Quantum GIS mapping software.

For example, my 6th grade students have just begun a unit on China.  As an entertaining but hopefully, useful exercise, I listed 15 cities, tourist locations, landmarks, etc., found in China.  The students had to locate them in Google Earth, take a screen shot, id the image, place it in a folder on their virtual desktop, and when complete submit the folder to me using Shared Documents.  My objectives - students get an introduction to the geography of China, they use Google Earth as a learning tool, they enhanced their image handling skills, and they have fun with geography while learning.

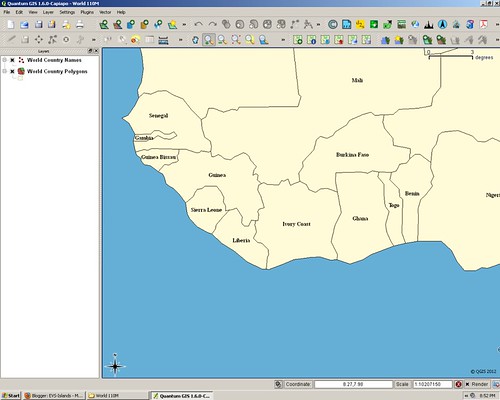
We will work with QGIS (Quantum GIS) during this unit.  I always like the students to create a vector layer of information on top of a georectified image.  This sort of project requires a great deal of patience and usage of a teaching method I call the "Louder Method".  If they don't get it the first time, just say it louder the next few times.  I'm just kidding.  Really.  REALLY!!

Enjoy!

Samana Cay BF - Columbus' First New World Landfall?

  Samana Cay - Landsat ETM+ Image N-18-20_2000 (1-85,000) 
Samana Cay - Landsat ETM+ Image N-18-20_2000(1:85,000)
 
Samana Cay - EVS Precision Map (1-85,000) 
Samana Cay - EVS Precision Map (1-85,000)
 
My interest in Samana Cay was the result of a serendipitous moment.  A few evenings ago while editing my Islands of the World point file, I became curious about the Turks and Caicos Islands.  Using my GSHHS World Shoreline map, I located the Turks and Caicos Islands.  Not an area I have done much mapping in, but interesting.  To the northwest was a small island off by itself, Samana Cay.  Nothing particularly outstanding, just a nice little island facing the Atlantic Ocean.  Curious soul that I am, I checked out the Wikipedia article and Wow!  Some scholars think this might be the site of Christopher Columbus' first landfall in the New World.  Pretty cool.

I identified the Landsat ETM+ mosaic, loaded it into Global Mapper and began mapping.  The completed map is nice.  The Landsat image is pretty cloudy.  More research and my next Wow!  Samana Cay is the largest uninhabited island in the Bahamas.  An uninhabited island close to home (USA).  How cool.

All of you Florida readers hunting for your Crusoe Getaway, Samana Cay could be your island.  People from Acklins Island visit periodically to collect cascarilla bark.  Other than the occasional Acklins Island visitors, you could be all alone contemplating whatever it is you want to contemplate.

Enjoy!

Thoughts - Quantum GIS, Africa and 6th Graders, A Recipe for Mapping Success.

QGIS West Africa Map

If you have followed my posts you know that I do most of my mapping work in Global Mapper, a solid mapping program that is easy to use and handles very large format image files with ease (Landsat, SRTM, GeoTIFF). However, it costs real dollars. Big bucks for me and unaffordable bucks to outfit each student workstation with a mapping package.  I have spent the last year learning how to make maps using Quantum GIS (QGIS), a well-maintained and powerful open-source mapping package.

I teach middle school students between the ages of 11 to 14, social studies which includes world history, US history and geography. We spend a good deal of time working with open-source software (OpenOffice, Irfanview, Audacity, etc.) to learn about our world and how to make effective use of technology in the classroom. I have always wanted to bring mapping into the classroom. This year I decided to give QGIS a try with my students. I was determined to teach my students how to identify and display spatial data on a map. That brings me to the West Africa map and QGIS..

This year all of my students are learning to make maps. They have learned the difference between vector files and raster images. They are becoming adept at labeling countries, cities, empires and city-states. They love to use all the wrong colors and fonts, but I let them because they are having fun making maps.  So far the projects have been relatively simple, but challenging in a mapping sort of way.

Today, my 6th graders (11-years old) were identifying and labeling countries in Africa using QGIS and a variety of vector files and a large format raster image of Africa taken from the Natural Earth website. They finished the country identification phase of the mapping project and wondered what to do next. I said, "Make a capital city point file and identify and label African country's capital cities."  In the past, I would have labored long and hard to teach them how to make and use a point file. We would have spent a great deal of time setting up the symbology and label parameters.  However, today within minutes all of the students created their capital city point file, defined parameters and were busy plotting capital cities. How cool is that!

Enjoy! I know I sure am!

Wednesday, April 20, 2011

Data - The Latest Edition of the WPI (World Port Index) from NGA Maritime Safety Information

One of the more popular data files offered from this site is the NGA Maritime Safety Information World Port Index. In 2006, I secured a copy of the WPI database in KML file format. For 2-years I made this abbreviated version of the WPI available to any wanting a copy.

In 2008, I secured a copy of the WPI in MS Access format. I reworked the data, getting an MS Excel spreadsheet which was ultimately converted into an ESRI shapefile which I made available to any wanting a copy.

I am not a regular visitor to NGA Maritime Safety Information, but today I chanced to visit it. In looking at the WPI and what was being offered, I was pleased to discover that they now offer the WPI in ESRI shapefile format.

So, here is the deal. If you want to download the WPI data directly from the NGA MSI unit follow this link. If you want to download the WPI shapefile and a pdf file of the WPI 150 book follow this link.

Enjoy!

Monday, January 17, 2011

Marmara Island TR - Modifying SRTM v4 TIF with EVS Precision Coastal Vector File

Turkey - SRTM Vector Modified

Turkey - SRTM with EVS Vector Modifications

The map of Turkey on the left is a portion of a 600-MB World Map created by Tom Patterson. His excellent and informative website, Shaded Relief, contains a wide variety of shaded relief maps. He explains how you could create your own shaded relief maps. I have been content to download his finished maps and use them in my classroom. The students love working with them.

I have been a long time user of SRTM data. Using tools within Global Mapper, I was able to generate interesting 3D views of islands. Last week I came across SRTM v4 data at CGIAR Consortium for Spatial Information (CGIAR-CSI), which I call Cigar (See-gar) for short. I downloaded a number of SRTM TIF images covering Turkey, where I am plotting Roman era towns and cities. Using the Shaded Relief Natural Earth 1 world map I was able to plot at scales of 1:1500000 to 1:1000000. When I attempted to work closer the map became a screen full of pixels. What to do?


Marmara Island - SRTM EVS Modifications Before and After (1-25,000)

Marmara Island - SRTM EVS Modifications Before and After (1:25,000)

The SRTM v4 data offered me some intriguing possibilities. First, I was able to zoom into areas at scales between 1:500,000 down to 1:50,000. At 1:50,000 I had to contend with pixels. The vertical side of a pixel in the part of the world I am working in is 90 meters, the horizontal side is 70 meters. Clunky looking when working at 1:50,000. It was then that I had my "ah-ha" moment. I loaded Landsat imagery on top of the SRTM imagery. I then digitized shorelines using the Landsat imagery (section 1). I switched off the Landsat imagery and my EVS precision shoreline cut through SRTM v4 pixels (section 2) and allowed me to determine the shoreline on the SRTM image. The SRTM modified shoreline is now useful to scales as fine as 1:25,000 (section 4).

I know! A 14.5 meter pixel defining a 90-meter pixels leads to potential problems. However, for my purposes, plotting Roman era towns and cities, these SRTMs modified with EVS precision shorelines work just fine.


Marmara Island Vicinity - SRTM with EVS Modifications Before and After (1-250,000)

Marmara Island Vicinity - SRTM with EVS Modifications Before and After (1-250,000)

And at 1:250,000, they look great!

A word about my custom hypsometric tints. The colors I initially took from the Shaded Relief website. But I have since tweaked them a number of times. The current version, certainly not my last, looks great for this part of the world.

I am slowly, but surely working my way around the shoreline of the Sea of Marmara, a place I spent time as a young man. I do hope this was both informative and interesting.

Enjoy!

Sunday, June 27, 2010

How To Digitize Vegetation and Land Layers using Landsat Imagery at 1:12,500 Scale

Faaite Atoll FP - Comparison - Landsat Image, EVS Precision Map, DigitalGlobe Image (1-12,500)

Faaite Atoll FP - Comparison - Landsat Image, EVS Precision Map, DigitalGlobe Image (1:12,500)

I keep telling all of you that I typically digitize off of Landsat imagery at approximately 1:12,500 scale. Checking out the above montage you will see a Landsat image of a portion of Faaite Atoll FP. Beneath it are two layers of information I digitized using Landsat as base imagery, vegetation and land. The final DigitalGlobe image from Google Earth is of the same stretch of atoll. The Landsat image has a green hue over all of the land and vegetation features. However, having digitized so many islands the sand or low vegetation, which I classify as land is identifiable. My Landsat derived vegetation layer is a decent approximation based on the vegetation shown on both Landsat and DigitalGlobe's hires imagery. The digitized land layer, I believe, is a strong match.

Why should one care at what scale one is able to digitize using Landsat as base imagery? Ask any photogrammetrist and they will tell you Landsat is reliable between 1:125,000 to 1:62,500. Each pixel covers a ground area of 14.5 meters by 14.5 meters. However, working at 1:12,500 does not render an image useless, but allows one to discern details in a rough but usable fashion. I can't make out individual trees, but I can identify stands of vegetation and most often the density of that vegetation. The most difficult feature on an atoll to reliably digitize is that portion of the reef which is awash depending on the time of day (high tide or low tide) and the amount of vegetation found growing on the reef. It is often difficult to determine whether the feature is above water land or below water shallow reef. Typically, if I'm uncertain I classify the feature as above water land.

Who knows, one day you might want to try your hand at island map making and you will want advise as to what scale you might expect to work at using Landsat as your base imagery. Digitizing at 1:12,500 should work just fine. Give it a try.

Saturday, June 26, 2010

Tepoto Nord FP - A Redo of a Redo of a Small Coral Island

Tepoto Island FP - Image

Tepoto Nord FP - Landsat Image from S-07-10_2000 (1:20,000)


Tepoto Island FP - ISS002-E-8862

Tepoto Nord FP - ISS002-E-8862 Image


Tepoto Island FP - Map

Tepoto Nord FP - EVS Precision Map (1:20,000)

My first map of Tepoto Nord was completed on March 31, 2006. I used Landsat as my base imagery. Most of my finish work was done using Marplot, a fine poor-man's GIS program. In December 2006 , I came upon the ISS image of Tepoto Nord. I decided to redo my original work using the ISS imagery to digitize from.

I look at my completed Tepoto Nord mapping project today and contemplate how far my map making skills have progressed. My digitizing of shorelines, vegetation and reefs remains fairly consistent. I routinely work at between 1:12,000 to 1:8,000, depending on my base imagery and the ultimate objective for my map. I am content to map four to five layers of information taking what Landsat is able to provide. The first time I mapped this island, I remember being frustrated by the Landsat imagery. The odd colors and blurred appearance of the island made digitizing problematic. Eventually, I came upon the ISS image and was able to redo my mapping of this small island in a more satisfactory manner. I reposted the map and base imagery in December 2006 and gave this small island no more thought.

That is until I received a question from an EVS Islands reader. He wanted to know everything he could about this small island. I answered that he should contact Alex W du Prel, publisher of Tahiti-Pacifique magazine. If anyone could give information about this small island, Alex is the man. After answering the reader's question, I checked out my map of the island. Unsatisfactory! The map presentation choices I make today are far superior to those I made in 2006. I decided to redo my redo of this small coral island.


Tepoto Island Nord FP - DigitalGlobe Image from Google Earth (1-12,000)

Tepoto Nord FP - DigitalGlobe Image from Google Earth (1:12,000)


Tepoto Island Nord FP - EEVS Precision Map (1-12,000)

Tepoto Nord FP - EEVS Precision Map (1:12,000)

I checked out Google Earth, as almost all of the islands within the Tuamotus are covered by DigitalGlobe's hires imagery. Sure enough, Tepoto Nord has excellent, cloud-free imagery from which I could redigitize various layers of information with a high degree of confidence. Seven layers of information later my redo of the redo is done. Since I have no designs to offer the map for commercial purposes, I decided to use DigitalGlobe imagery as my base imagery. I have worked on this redo of a redo for about two weeks. Not because it was particularly difficult, but I've been busy with school. Finally, I have a Saturday with no pressing projects. Only this, to finish my Tepoto Nord FP map. Pretty nice, huh?

Enjoy!