Monday, December 31, 2007

Comparison - WVS, SWBD, NGA PGS Global Shorelines and EVS Precision Shorelines

Shoreline Comparison

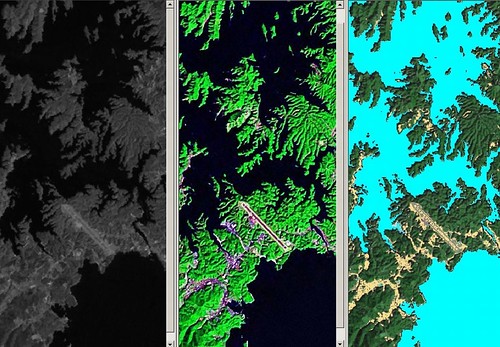
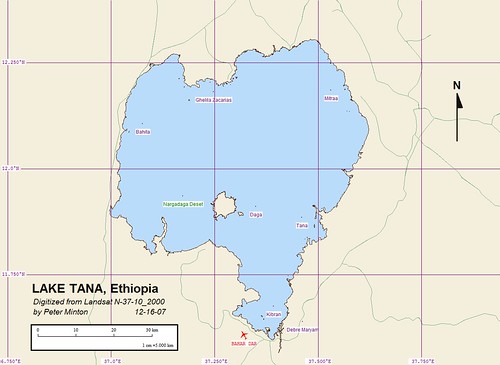
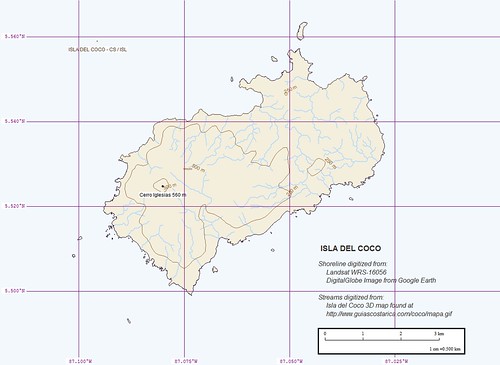
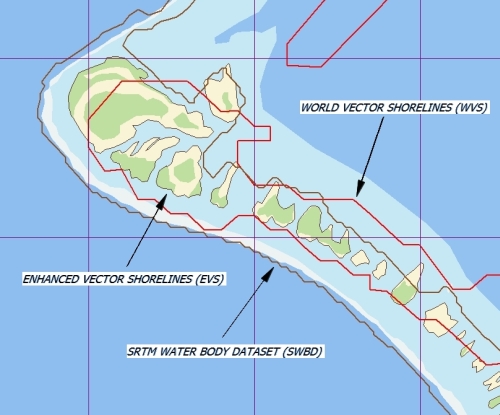
Three Vector Shoreline's Compared - WVS, SWBD and EVS Precision

One of my readers suggested I evaluate SWBD shorelines in comparison to other freely available shorelines. Previously, I compared these shorelines with my own EVS precision shoreline. I'll do it once more.

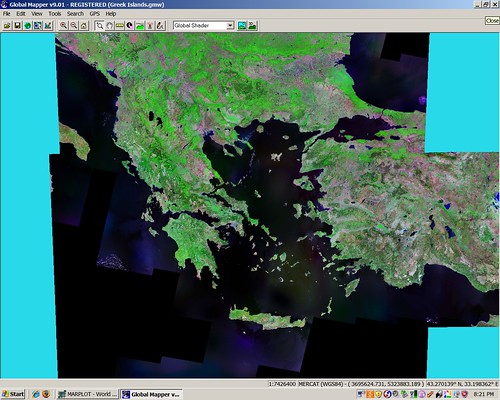
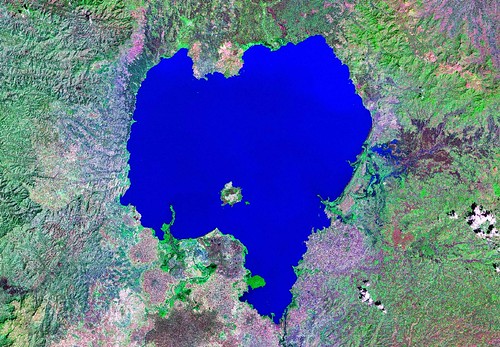
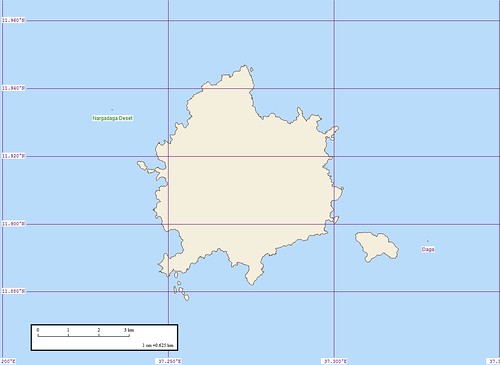
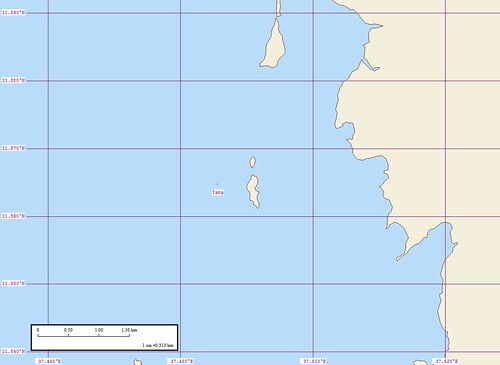
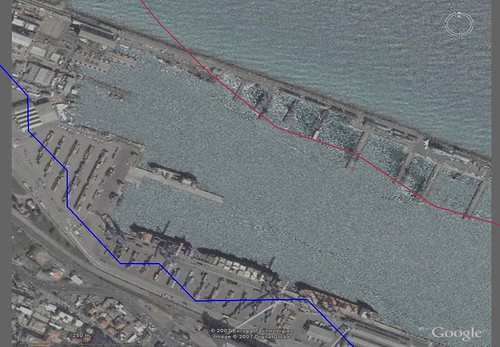
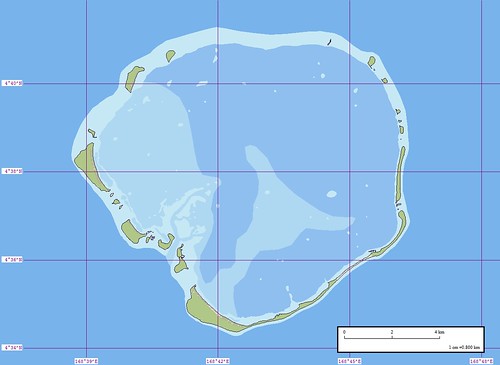
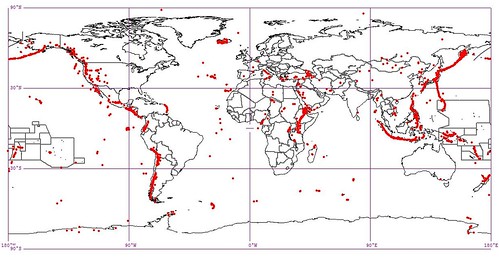
The WVS is widely available and manageable in size. There is another popular version of it called the GSHHS. It repairs varous WVS anamolies. In addition, it conveniently breaks the dataset into land, lakes, ponds and islands. At only 56MBs zipped, it is a very attractive option. As one can see in the two images, the WVS is the least precise of all large scale global shorelines. It is designed to be used at scales of 1:250,000 and above. For most of us designing projects for our classroom, employers or customers, this dataset does a fine job, it is free and the size is reasonable. It is when we need to do large scale precise shorelines that we require the next best global shorelines

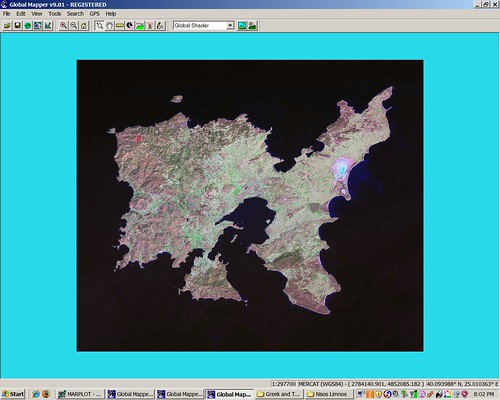
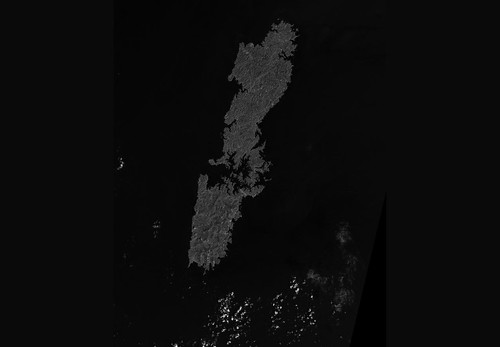
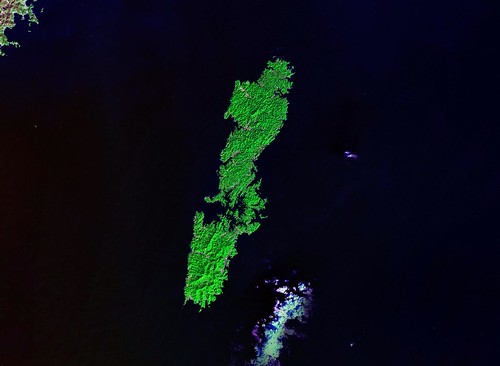
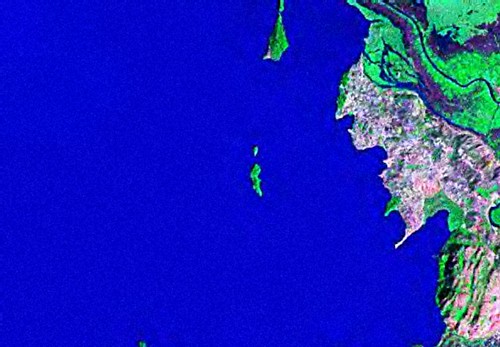
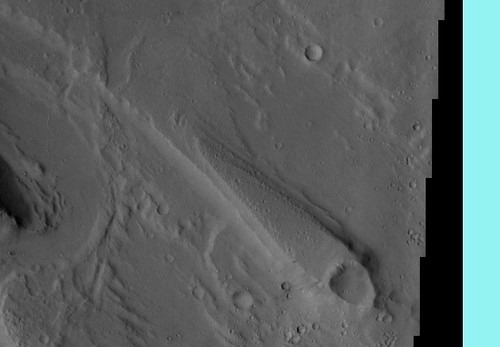
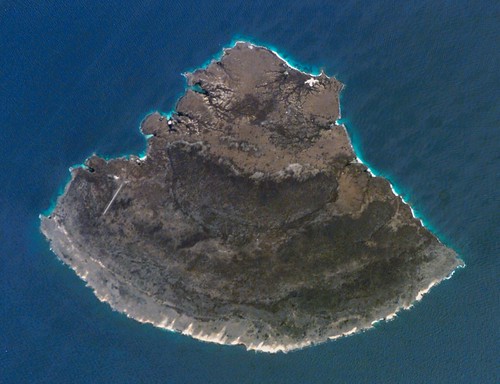
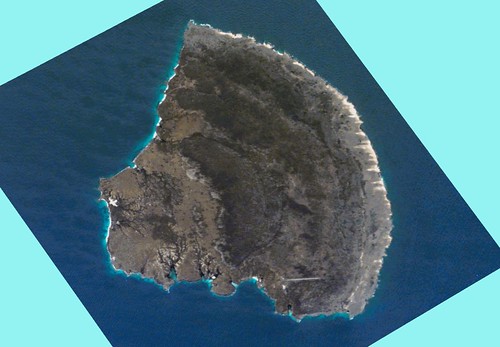
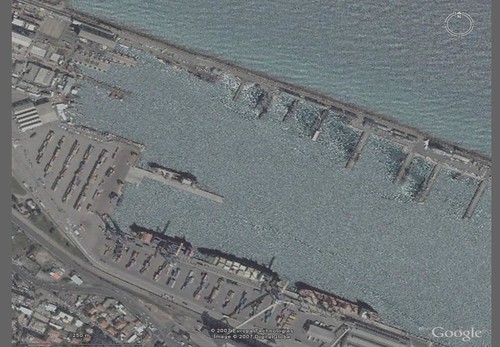
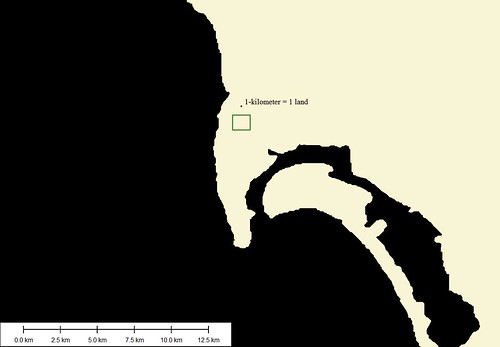
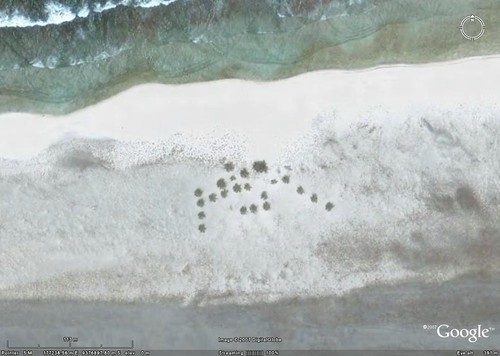
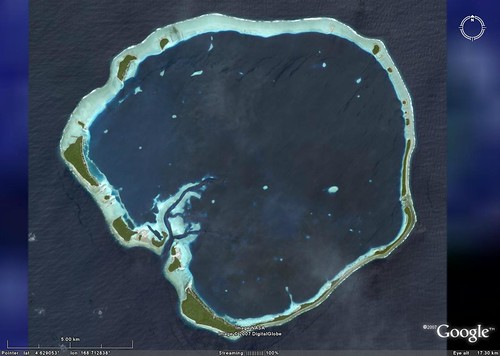
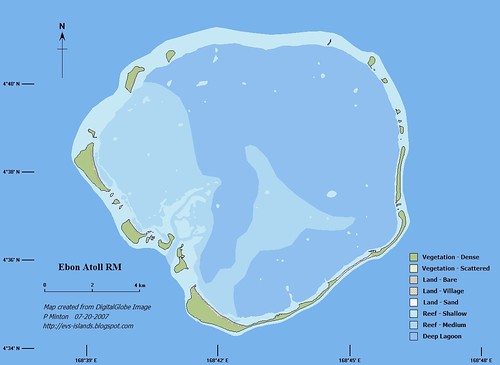
Although the SWBD is a quality product and provides the end-user with precise SRTM water-defined shorelines, it tracks the water. The SWBD attempts to identify the place where the water meets the shore. That should be the shoreline, but it isn't. The top image shows the SWBD shoreline tracking the reef edges and ignoring the numerous motus within the reef. For us island mappers, the SWBD is not precise enough to identify the many shoreline features we require.

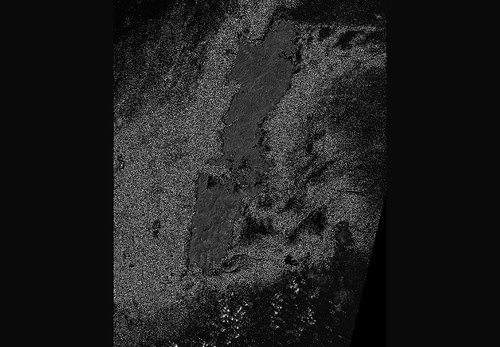
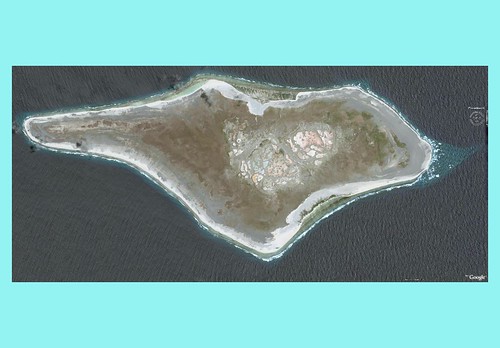
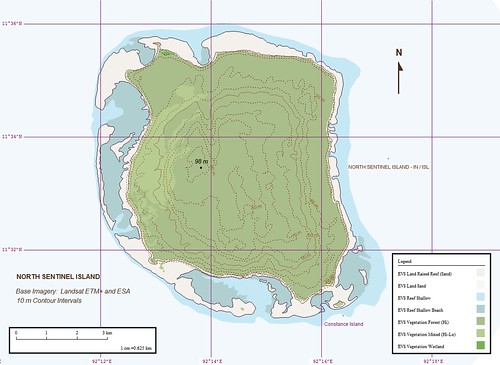
The same can be said for the NGA PGS shorelines. They are extremely precise, using Landsat ETM+ imagery as their base imagery. This is the same imagery I use to construct my EVS precision maps. I have the NGA PGS shoreline loaded into Marplot, a mapping package I use. The dataset is divided into 24 separate groups. My global coverage, using this dataset, is outstanding - except where clouds or other atmospherics obscure the shoreline or the shoreline consists of water-inundated areas (marsh, swamp, mudflats), which the NGA PGS product didn't identify. The cloud obscured areas on Landsat ETM+ imagery are validly poorly mappable to unmappable. The water-inundated areas are mappable, but the NGA contract called for the exclusion of these shoreline features, thus they were not mapped. I beg to differ. This is shoreline that must be mapped. There are massive river deltas NGA PGS mapped that depict shorelines that look nothing like the original Landsat ETM+ image, which is full of features that the NGA PGS product did not map. They just happen to be water-inundated. They are features you and I would describe as shoreline. Make no mistake, when the shoreline is cloud-free and not water-inundated, which most Landsat imaged shorelines are, this global shoreline dataset is outstanding. It's just all of those river delta islands that they didn't map that I have a problem with.


Comparison 4-Vector Shorelines (1)

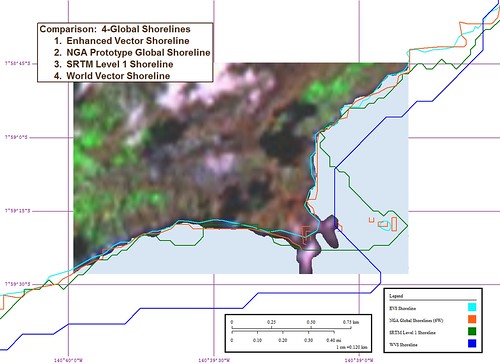
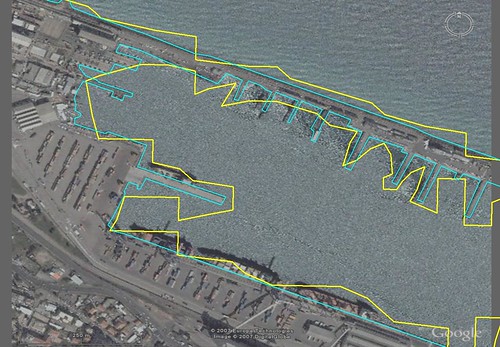
Four Vector Shoreline's Compared

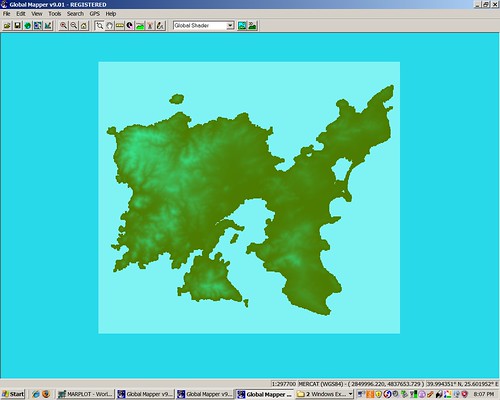
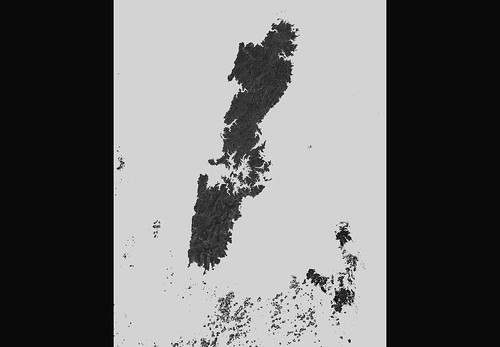
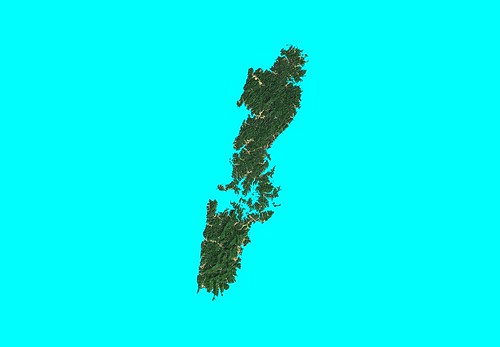
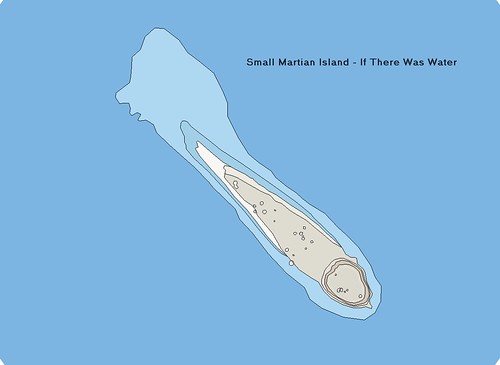
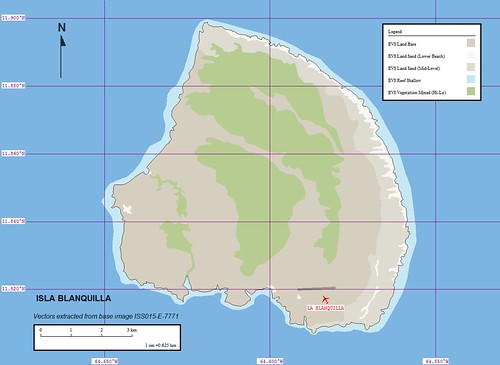
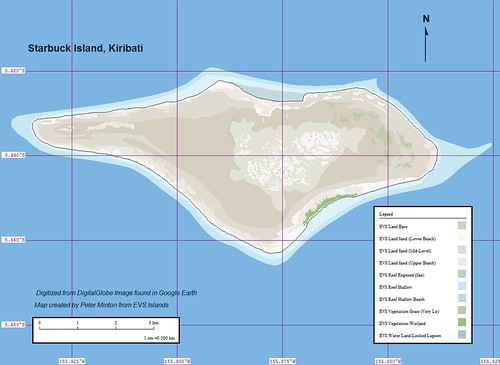
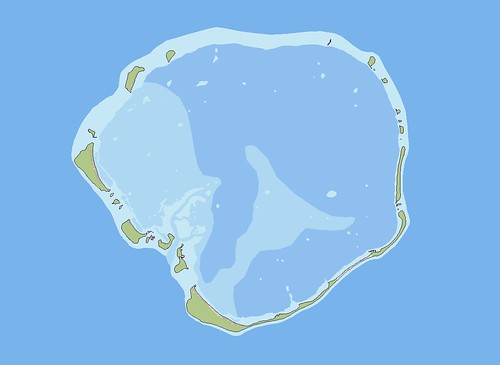
However, my EVS precision shorelines are pretty outstanding as well. When one compares my hand-drawn shorelines to programmed color tracking shorelines (or many other automated processes), my hand-drawn shorelines track quite precisely. Something about using one's brain processing powers, manual dexterity and years of experience that consistently allows one to create more precise shorelines than the WVS, SWBD and NGA PGS products.

As I work with Landsat ETM+ imagery and learn more about the digitizing craft, I am certain software is available that could do what I do more accurately, faster and in much less time. But it wouldn't be as much fun! Would it?

Enjoy!

Wednesday, December 26, 2007

Thoughts - Landsat Island Image Mosaic

I have over 600+ Landsat ETM+ Orthorectified Mosaics that two summers ago I patiently downloaded and copied onto a series of DVDs. These mosaics cover all of the shorelines and oceanic islands throughout the world. It is an impressive collection. This collection, coupled with Global Mapper v9.01 (GM), allows me to load and view the individual mosaics as I desire. Each mosaic, even compressed in MrSID format, is typically 100 to 250MBs. Them is some big files!

Over a year ago I had a discussion with a reader who wished to work with these files to make his own maps. I described where he could download the files. But, alas, he said the files, even in MrSID format, were too large for his system. Was there a smaller file of just individual islands, he asked. Not to my knowledge, I guessed and went back to making maps of islands.

That was until this past month and my work in image mosaics. First I worked with DigitalGlobe imagery. Sadly, they have never responded to my product idea. Oh, well, so goes life. Lately, I've been working with Landsat ETM+ again. And the following is my latest idea - Landsat Island Image Mosaic or LIIM.

Greek and Turkish Islands -  Landsat ETM+ Mosaics

Greek and Turkish Islands - Landsat ETM+ Mosaics

Some of my earliest mapping efforts were of Greek and Turkish islands located in the Aegean Sea. This area is virtually cloud-free and the clarity is outstanding. However, it takes seven Landsat mosaics to cover the area. Using a raster export feature within GM, I experimented with various raster formats and came up with georeferenced JPG. Pixel size of each resulting LIIM is 14.5-meters, 300 DPIs and projection is Mercator. The resulting image is outstanding.


Nisos Limnos - Landsat ETM+ N-35-35_2000

Nisos Limnos - Landsat ETM+ N-35-35_2000

I zoomed into my target area encompassing the primary island and created the georectified JPG. The above Nisos Limnos LIIM taken from GM gives the user the complete resolution power of Landsat ETM+ without the size problems. The above file, along with it's accompanying DEM, is only 7.2MBs.


Greek and Turkish Islands -  SRTM Tiles

Greek and Turkish Islands - SRTM Tiles

To really bring the Nisos Limnos LIIM to life, the SRTM data is the ticket. To cover the Aegean Sea one needs 83 individual SRTM tiles. Loads of data for most of us. Many of these tiles require some fixing, which is done using SRTM Fill (freeware) to fill holes. Once this data is loaded, GM allows for DEM creation. One is able to take the Nisos Limnos DEM and drape the Nisos Limnos LIIM on top and get a variety of 3D views of the island.


Nisos Limnos - SRTM N039E025

Nisos Limnos - SRTM N039E025

So I exported the underlying area into DEM format. This allows for some nifty looks at the island


Nisos Limnos - 3D View

Nisos Limnos - 3D View

Pretty cool! This is the Nisos Limnos LIIM draped over the Nisos Limnos DEM. All of this wrapped up in a 7.2MB package. I like it. How about you?

I should add that I have created 16 Greek and Turkish Island LIIMs. The following islands have LIIMs - Bozcaada, Gokceada, Nisida Fournoi, Nisida Gioura, Nisos Agios Efstratios, Nisos Alonnisos, Nisos Chios, Nisos Ikaria, Nisos Lesbos, Nisos Limnos, Nisos Pelagos, Nisos Samothraki, Nisos Skiathos, Nisos Skopetos, Nisos Skyros and Nisos Thasos. I intend to complete coverage of the islands of the Aegean before I head back to school on Jan 03, 2008.

Enjoy!

Thursday, December 20, 2007

How To Colorize a Black and White Landsat WRS Image

Tsu-Shima - Landsat from USGS WRS - Original Image (1-500,000)

Tsu-Shima - Landsat from USGS WRS - Original Image (1:500,000)

I did my "load and explore" exercise, where I take a random Landsat ETM+ mosaic, load it and see what looks interesting. Fortunately, I traveled to a part of the world I studied while in college, Japan. Although I speak some Mandarin Chinese and very little Japanese, my emphasis within my Asian Studies major was Japan. The islands making up Tsu-Shima rest between Japan and Korea. Both Korea and Japan claim ownership, but it appears Japan has "squatters rights" to the islands. The islands have a long history of human occupation, but the current human footprint is relatively small - over 85% of all of the islands land area is in a natural state.

So, why not transform the black and white Landsat WRS image into a useful colorized image. I decided to give it a try.


Tsu-Shima - Landsat from USGS WRS - Creating Land Mask (1-500,000)

Tsu-Shima - Landsat from USGS WRS - Creating a Single Color Sea Mask - First Pass (1:500,000)


Tsu-Shima - Landsat from USGS WRS - Sea Mask a Single Color (1-500,000)

Tsu-Shima - Landsat from USGS WRS - Sea Mask as a Single Color (1:500,000)

My first task was to isolate the land area making up Tsu-Shima islands. I did this using a feature within Global Mapper v9.0 that allows you to isolate certain colors and to make them transparent. One merely identifies a RGB (i.,e., 010,215,215) color and turns it off. The first image in the two above shows a first pass. It took seven passes to convert the sea mask into a single color. Each pass required that I save the modified raster image as a TIFF file. After a number of passes, I ended up with the second image. The cloud-like features in the lower portion of the image are clouds. They were dealt with later.


Tsu-Shima - Landsat N-52-30_2000 (1:500,000)

Tsu-Shima - Landsat N-52-30_2000 (1-500,000)

The Landsat ETM+ image taken from N-52-30, has way too much black and the shoreline is tough to clearly makeout. I am certain others could easily determine shorelines with a smart routine that identifies shoreline colors, but I don't have this level of expertise or the software. So, I forged ahead in my pedestrian manner. Taking the above Landsat ETM+ image, which is georectified, I overlaid my modified Tsu-Shima Landsat WRS image on top of it. Again, using a Global Mapper v9.0 feature, I made the top image (Landsat WRS) 60% transparent, allowing the green vegetation layer to appear to drape onto the top image.


Tsu-Shima - Landsat from USGS WRS - Land Mask Colored (1-500,000)

Tsu-Shima - Landsat from USGS WRS - Land Mask Colored (1-500,000)

I saved the resulting image, moved it into ImageForge, my "poor man's Photoshop", and touched it up. I made the sea mask a single blue color and the urban areas were changed to a gold color. I saved the modified image. I loaded this final Tsu-Shima image into Global Mapper, where it was georectified. Tsu-Shima image is good to use between 1:500,000 to 1:62,500. Anything larger and the shorelines are a series of clunky pixel shapes.


Tsu-Shima - From Landsat WRS to Landsat Modified

Tsu-Shima - From Landsat WRS to Landsat Modified - Central Detail

From a black and white Landsat WRS to my Landsat modified image took 4-hours to complete. I have a series of georectified TIFF image of the islands. As with all of my previous projects, they are available at no charge. Just drop me a line and let me know what you need. I like the look of my Landsat modified image of Tsu-Shima. Don't you?

Enjoy!

Monday, December 17, 2007

Tana Island and the Ark of the Covenant

Lake Tana - Landsat N-37-10_2000 (1-500,000)

Lake Tana - Landsat N-37-10_2000 (1:500,000)


Lake Tana - EVS Precision Marplot Map (1-500,000)

Lake Tana - EVS Precision Marplot Map (1:500,000)

At times I like to open a Landsat ETM+ of a region of the world and explore. This time I traveled to Africa, specifically to Ethiopia. I know the country of Ethiopia is perched on highlands and Lake Tana is the primary source of the Blue Nile. I also have read the story of the Ark of the Covenant being spirited away from Israel first to upper Egypt at Elephantine Island, then to Tana Island and finally to St Mary of Zion Church in Axum. My curiosity about Tana Island got the best of me. My first task was to research to see if any maps of the island were available via the Internet. Nothing! Not even of the lake!

So my first task was to rectify the mapping of Lake Tana. The only mapping I have depicting this lake are at a scale of 1:1,000,000 (DCW). The shorelines are very coarse approximations of the Landsat imaged shorelines as depicted on N-37-10_2000. I have spent the last 6-hours mapping the shoreline of this lake. I worked at a scale of 1:31,250 for all mapped shorelines. Smaller islands in the lake were mapped at an even larger scale. The lake's shorelines were easy to discern and digitizing was uneventful, but tedious.


Nargadaga Deset - Landsat N-37-10_2000 (1-62,500)

Nargadaga Deset - Landsat N-37-10_2000 (1:62,500)


Nargadaga Deset - EVS Precision Marplot Map (1-62,500)

Nargadaga Deset - EVS Precision Marplot Map (1-62,500)

This is the largest island within the lake and the largest island in Ethiopia. I carefully digitized it's shorelines, figuring the largest island had to be Tana Island. That is until I finished and began working in Marplot. It is there that I have my EVS Island name file (86,000+ named islands). It turns out bigger is just bigger. It is not Tana Island but Nargadaga Deset. Although it is a holy island, it wasn't the holy island I wanted.

After a little searching I found Tana Island located along the eastern shore of the lake. Not a large island, but at one time, the reputed resting place of the Ark of the Covenant.


Tana Island - Landsat N-37-10_2000 (1-31,250)

Tana Island - Landsat N-37-10_2000 (1:31,250)


Tana Island - EVS Precision Marplot Map (1-31,250)

Tana Island - EVS Precision Marplot Map (1:31,250)

Here is Tana Island, all of 500-meters by 50-meters. It is a holy island, with a monastery located on it. No woment are allowed to visit the island. The priest living on the island will show any men visitors where the Ark was kept while on the island.

This was a fun mapping project. I got to map a number of islands at EVS precision. I went back to my mapping roots using Landsat ETM+ as my base imagery and didn't have to worry about offending any image owners and I mapped a major lake to boot! Now, that's living the high life.

Enjoy!

Tuesday, December 11, 2007

Thoughts - Ask the Owners of the Images! Not the Users!

Last week, in my naive excitement to share a product idea with readers of this blog, I did something wrong. Sharing the product idea - that was fine. However, it was brought to my attention that my proposed product sounded like a real product. IT IS NOT A REAL PRODUCT! It is merely an idea I shared to solicit feedback on its potential viability as an image tool.

I admit, as I reread my post,it sounded as if I were offering the proposed product for sale, something I would NEVER do without permission from both DigitalGlobe and Google Earth. It seems one of my readers took offense at the language of the post and an offer to let readers view a product prototype, at no cost. After thinking about my offer to allow readers to download the proposed product, I decided that it was a poor idea for a number of reasons, so I withdrew that post and previous posts that discussed this proposed product. I will handle this proposed product idea with the parties involved and not with my readers

Now I want to share what I felt as my motives and character were being discussed by strangers via a comment thread on the blogsite Technical Ramblings. First, I felt pissed that my innocent motives were being challenged by someone who doesn't know me, and only knows my posts. I felt I was being called a thief for allegedly stealing images from both DigitalGlobe and Google Earth. Worst, this individual intimated that I was doing this knowingly. I attempted to defend my motives and apologize for any misleading statements I might have made, to no avail. The scolding continued and a suggestion that I read a September thread discussing the proper uses of Google Earth images. I read the thread and, thank God, after reading it I snapped out of it.

The next morning, I contacted a well-placed representative of DigitalGlobe about the "fair use" of their imagery taken from Google Earth. This individual is well aware of my work and has viewed it a number of times. He assured me that my use of their product, to derive my island maps from, was okay! His only caveat was that my maps and the use of their images was not to be used in a commercial operation and I DO NOT sell my maps or their images, DigitalGlobe is fine with what I do. As to my proposed product idea, that is now between me and DigitalGlobe.

When I first began making maps of islands, using DigitalGlobe images fround in Google Earth, I spoke with a Google Earth representative who repeated the same approval of my island mapping and the use of their imagery to better share my mapping efforts. I was told to include all appropriate trademarks on the images and to not produce maps or to use their images for profit. This person suggested I contact DigitalGlobe to secure their permission as well, which I did.

This is my lesson learned - avoid threads, no matter how well intended the parties might be. Most often the comments are strictly opinions of people like you and me, they just sound more learned then we do. The bottom line is if you want to determine once and for all if your actual or intended use of images or derivatives taken from those images is "fair use" or allowed or how ever you want to describe it, ask the owners of the images, in my case DigitalGlobe and Google Earth. Both parties approved my use of their images. So, that's that.


Thursday, December 6, 2007

Ancient Small Martian Island - If Only There Was Flowing Water!

Small Martian Island - Mars Mission Image

Ancient Small Martian Island - Mars Odyssey THEMIS Image (19-meter)


Small Martian Island - EEVS Map

Ancient Small Martian Island - EVS Map (19-meter)

What if the surface of Mars could be flooded to a depth of 20-meter? There would be islands where hills stand today. One of these islands would be this unnamed small island located in Ares Valles (16-lat - 30.4W lon). It would look like a barrier island, a 2-meter above water sand spit, shaped by tides and wind.

This is my first extraterrestrial island project. It took about 1-hour to complete. The circles scattered about are meteor plunks, most probably the large one's ejecta. The link to the Mars Odyssey website gives the curious reader loads of information about the area and the dry island features.

Perhaps if we pray for rain, Martian rain, and an increase in temperature, the seas will flow once again and this small island will live once more.

Enjoy!

Friday, November 30, 2007

Comparison - Google Earth Georectification vs Landsat ETM+ Georectification. Who is Right?

My previous post elicited a question asking which image was georectified properly and wondering if I had verified the projection. I am a trusting soul and if, in the instance of my previous post, the NGA PGS vector coordinates are what I used to georectify the ISS image. I am reasonably confident the ISS image fit precisely into the NGA PGS vectors. Ultimately the ISS image I fashioned used a Geographic (latitude/longitude) projection with WGS-84 datum.

This evening I loaded the Landsat ETM+ orthorectified mosaic N-20-10_2000, which includes Isla Blanquilla, into Global Mapper. It loaded quickly. I zoomed into Isla Blanquilla at a scale of 1:62,5000, which was the scale of my final map project. I then loaded the ISS georectified base image of Isla Blanquilla on top of the Landsat image. It is right on! A precise fit. However, yesterday when I attempted to create an overlay of the ISS image in Google Earth and after spending 15-minutes stretching and twisting the image, it never quite fit. It was alway alittle off.


GE to Landsat Rectification Offset

Google Earth to Landsat ETM+ Georectification Offset

This evening, I recorded the lat/lon location of three relative ground control points within Google Earth and in Global Mapper's Landsat display. They each showed the same image of Isla Blanquilla and supposedly at the same location. Each relative ground control point was easily discernible. After recording lat/lons for each point and determining the difference, it seems someone is off anywhere between 2-meters and up to 63-meters for this single island. So, who is it? Who has misplotted this island? Is it Google Earth or Landsat ETM+? Care to guess?

Enjoy!

Isla Blanquilla VE - ISS Island Image Transformed into EVS Precision Map

Isla Blanquilla - ISS015-E-7771 Image

Isla Blanquilla - ISS015-E-7771 Image

A few days ago Earth Observatory carried this image of Isla Blanquilla and an interesting article about this small island located NE of Caracas Venezuela. Granted, if you are a US citizen, it is probably not your first choice to visit on a leisurely vacation due to the strained relations between our two countries, but the ISS image is pristine and details are mappable compared to the partially cloud-obscured Landsat ETM+ image. DigitalGlobe has never snapped a pic of this island either. So, I made do with the ISS image and created my map over a 4-hour period.


Isla Blanquilla - ISS015-E-7771 Georectified Image (1-62,500)

Isla Blanquilla - ISS015-E-7771 Georectified Image (1:62,500)

In order to use any non-georectified imagery, one must georectify it. I use Global Mapper to georectify. I loaded NGA PGS shorelines of this island (Region 14). These shorelines are very close to Landsat ETM+ shorelines. I selected 4 easily definable points on both my loaded shoreline line file and on my ISS image. It took about 10-minutes, with most of the time spent watching TV. Once the image was georectified, I began the task of digitizing the island shoreline, lower beach, upper beach, bare island, hi-low vegetation, airfield and the shallow reef surrounding the island.


Isla Blanquilla - EVS Marplot Map (1-62,500)

Isla Blanquilla - EVS Marplot Map (1:62,500)

Once the digitizing was completed, I imported the completed layers into Marplot, where I still do much of my preliminary map construction. I am just used to working with it. I defined each layer and assigned it to pre-existing EVS layers. I did a quick layout of map titles, legend, scale and north arrow. Done!

At this point, I typically post. One day when I am given the opportunity and the time, I will "fancy" up my map using ImageForge prior to posting. Until that day arrives, this is as good as it gets.

Enjoy!

Monday, November 26, 2007

Data - Global GSHHS Land Mask in SHP Format

Global Land Mask

Global Land Mask using GSHHS Modified WVS

For all of you requesting the Global GSHHS Land Mask in shp format follow this link and you can download a copy. The file is 66MBs.

Enjoy!

Sunday, November 25, 2007

Comparison - Haifa Harbor Using 1:2000000, 1:250000, NGA PGS and EEVS Precision Shorelines

Haifa Harbor - DigitalGlobe Image from Google Earth (1-4,600)

Haifa Harbor - DigitalGlobe Image from Google Earth (1:4,600)

Let's begin this comparison of shoreline accuracy by superimposing four shorelines onto a 1-meter resolution image of Haifa Harbor. Why Haifa? Just because I happened to be making a land-sea mask in this part of the world. My initial study focused on using NGA's Prototype Global Shorelines (PGS) created from Landsat ETM+ imagery. As you will read and see this global shoreline is one of the most detailed available. It does have a few negative considerations, like "stuttering" shorelines, non-mapping of water-inundated land (swamps, marshes, etc.) and hand-tracing of shorelines is more accurate than the software generated shorelines...but, that said, NGA PGS shoreline is a great first-step toward a global shoreline for all of us.


Haifa Harbor - 1-2,000,000 (Red) and 1-250,000 (Blue) (1-4,600)

Haifa Harbor - 1:2,000,000 (Red) and 1:250,000 (Blue) (1:4,600)

The 1:2,000,000 (Red) shoreline is, by virtue of it's name, designed to be used at 1:2,000,000 or smaller resolutions. It works well for coarse shoreline delineation to get "an idea" of where the shore ends and the sea begins. The 1:250,000 goes by the acronym W(orld) V(ector) S(horelines). It was originally extracted from Tactical Pilotage Charts. It gives one a useful shoreline for a wide variety of projects. However, when one pushes it beyond 1:250,000 it quickly proves inaccurate in tracing the actual shoreline.


Haifa Harbor - NGA PGS (Yellow) and EEVS Precision (Lite Blue) (1-4,600)

Haifa Harbor - NGA PGS (Yellow) and EEVS Precision (Lite Blue) (1:4,600)

Now for the good stuff! The NGA PGS precision shorelines do a fairly good job of tracking the actual shoreline. They are deemed appropriate at scales between 1:125,000 to 1:250,000. Some areas could be pushed to 1:62,500, but be careful. I am careful and I push them below 1:62,500, for digitizing purposes, in order to confirm my Landsat derived hand-made vectors are of greater precision than the PGS. And mine are! For the purposes of this comparison the PGS shorelines would give a person an accurate shoreline impression as long as it was not superimposed over the actual shoreline. The lite blue line is what I call E(xtremely) E(nhanced) V(ector) S(horelines). They are derived from DigitalGlobe's 1-meter resolution imagery found in Google Earth. Oh, that all the world were imaged at 1-meter cloud-free resolution. I feel that is a long way coming and I don't think the global shoreline vector files derived from them will be free. I suspect they will be quite costly.

Back to the land-sea mask, or what started this current study. The most accurate vector based global land-sea mask is mine. I call it GSHHS Derived Global Land-Sea Mask and you can download a copy here. Be forewarned, the file is 83.9MBs zipped and 340MBs unzipped.

The most accurate future global shoreline map should be the NGA PGS precision product, but it needs work to finish it (correct stutters, map non-mapped areas, etc.). Once it is finished, it will be THE GLOBAL SHORELINE. Until then, WVS rules.

Enjoy!

Friday, November 23, 2007

Data - Global Land Mask using Vectors instead of 1-Kilometer Grid Cells

Global Land Mask

Global Land Mask using GSHHS Modified WVS

Regular readers know that I am a long time user of World Vector Shorelines (WVS). These vectors cover the world at a scale of 1:250,000. If you download them, you will see that they are not polygons, but line files. I have always wanted to create a land-mask of all land areas within this database, but have never had the time, software or computer calculating power. That was until yesterday. A reader asked if I knew whether their was a land-sea mask at better resolution then the 1-kilometer grid cell version currently available. To tell the truth, I didn't know about land-sea mask maps. After a brief search of some of my sources I found out that the main global land-sea mask was something build back in 1996 using WVS. Instead of using vectors as the deliverable, the builder fashioned the 1-kilometer grid map.

I let my reader know that the 1-kilometer global land-sea mask he currently was using was, probably, the best going. He knew of the Globcover LULC 300-meter grid cell version coming out in the first part of February 2008 to be created and made available by ESA.


Global Land Mask - Eastern Canada and US

Global Land Mask - Eastern Canada and US

Curious soul that I am and having time, software and computer capabilities, I decided I would create my own global land mask. I loaded the land files taken from GSHHS, a modified version of WVS, into Global Mapper. Using a simple routine within the digitizing tools, I created polygons from lines. Simple process, but very long processing time. Eurasia took over 4-hours to process. After working at it all day and night, I came up with my vector version of a Global Land Mask. The entire file is 340MBs in size (84MBs zipped). It takes about 3-minutes to load into GM, but wow! It does look pretty cool.


North America Land Mask from GSHHS (1-125,000)

Global Land Mask - San Diego with 1-kilometer grid cell (1-125,000)

The above image is at a scale of 1:125,000 (1-inch to 2-miles). The 1-kilometer grid cell is placed on the map to give you an idea of the coarseness one gets using the existing global 1-kilometer grid-cell map. Even though it was derived from WVS vectors, not using the power of vectors (infinite zooming capabilities) one encounters an unnecessary coarseness not evident in the vector-based product.

I think my vector-based product is an example of a wonderful land-sea mask.

Enjoy!

Monday, November 19, 2007

Starbuck Island, KR - Tough Little Island

Starbuck Island - DigitalGlobe Image from Google Earth - 13 Tile Mosaic with Ocean Fill

Starbuck Island - DigitalGlobe Image from Google Earth - 13 Tile Mosaic with Ocean Fill


Starbuck Island - EEVS Precision Marplot Map (1-50,000)

Starbuck Island - EEVS Precision Marplot Map (1:50,000)

This island was a challenge to digitize. Working off of my 13-tile Starbuck Island DIGM (DigitalGlobe Image Mosaic) and using Global Mapper digitizing tools, I spent Saturday, Sunday and Monday completing my map. The best view for this map comes from selecting it and looking at the full size image in my Flickr account. This map is a semi-fancy composition. To completely fancy this map would take another 2 to 4 hours and I wanted it posted instead of fancied.


Starbuck Island Interior AKK_075

Starbuck Island's Interior (AKK 075, PBIF Photo)

I hope my map gives one the same message as this picture (see photo credits) of Starbuck Island's interior. The plants you see in the foreground are "sticker" bushes. This is a desert island. The location is such that it gets very little rainfall. But the little island continues - it is a tough little island.


Starbuck Island's Forest - DigitalGlobe Image in Google Earth

Starbuck Island - The Forest

Along the northwest shore is the Starbuck Island forest. It consists of 22 palm trees. I suspect that if these grow more will be planted.

Enjoy!

Wednesday, November 7, 2007

Ebon Atoll RM - One More Look At A Quality Map

Ebon Atoll DG Image Complete

Ebon Atoll - DigitalGlobe Image from Google Earth (1:80,000)


Ebon 80 LL scale

Ebon Atoll - EEVS Marplot Map (1:80,000)


Ebon 80 clr

Ebon Atoll - EEVS Map Clear Version (1:80,000)


Ebon Atoll RM - EEVS Map Final Version (1-80,000)

Ebon Atoll - EEVS Map Final Version (1:80,000)

The final map in this series of images is what I would like to be able to consistently produce. It was compiled at 300 dpi size using ImageForge software. The problem I face is one we all share - great objectives, not enough time. A critical key to my map-making avocation is to either get funding so that I can make MY ISLAND MAPS all of the time or retire and make maps. The first option hasn't happened yet, but I always have hope. The second option is still a few years away. So, I just do what I am able to do and make as many maps as my busy life will allow. Enough about me and my "Oh, Woe is me!" situation.

These images were part of a project I completed in July 2007 while on vacation. The first post was Ebon Atoll RM - Preliminary Maps and the second was Ebon Atoll RM - Fancy Map. I took both the clear Marplot map and the Lat/Lon Marplot map, using ImageForge, I added the finer details that I desire for my completed map projects. The final product, fancied up in ImageForge, is a far superior presentation compared to the Marplot product.

Given time - all of my island mapping projects should be of this quality. Anybody have any extra time I can use?

Enjoy!

Friday, November 2, 2007

South Sentinel IN - Uninhabited Tropical Paradise If You Can Deal With Mosquitos, Coconut Crabs and No Fresh Water

South Sentinel Island - Locator Map

South Sentinel Island - Locator Map


South Sentinel Island - TerraMetrics Image from Google Earth (1-9,000)

South Sentinel Island - TerraMetrics Image from Google Earth (1:9,000)

A few days ago I completed a mapping project of North Sentinel Island. During the research phase, I learned that there were two Sentinel Islands - North and South Sentinel. South Sentinel is about 160 hectares in size. There is an abandoned lighthouse on the island. Other than the lighthouse, no other human marks are on this island. The v-shaped dark area is a periodic swamp. At low tide it is dry, at high tide it is full of salt water. According to a hearty traveler that spent 10-days on the island back in 2000-something (before the earthquake and tsunami), the island can be alluring, if one can repel the mosquitos, avoid the coconut crabs that could pinch a human leg off, and a few other challenges this small island throws at you (no fresh water save the rain). The article is an excellent read and it will either entice you to dream of a visit to this small island or cause you to relish life in your safe home. You know, the one with running fresh water, plumbing and a 'fridge full of midnight snacks.

Enjoy!

PS - Since the 2004 earthquake and tsunami, South Sentinel Island has undergone significant reshaping. Reefs are above water that were below water before and one of the beaches is now underwater. I have no images of the island showing the new shape.

Tuesday, October 30, 2007

Thoughts - Marplot, A Beginner's Mapping Package

Europe - WVS Marplot Map (1-392 km)

Europe - WVS Marplot Map (1:392 km)

I do much of my mapping using Marplot. This free, tax-payer-dollars-funded mapping program was initially designed to help environmental emergency responders detail their findings. NOAA also did work with the software, not sure what they did, but they did it. With the advent and purchase of robust, powerful, complex and expensive mapping packages, the government use of this product is shrinking. Their serious mapping efforts are handled by the ARC GIS mapping packages and some MapInfo. But Marplot still exists and the price is right - free!

The learning curve for this mapping package is fast. The ability to compile multiple layers of information and control their symbol, color, range, line-width, and fill is nice. My World Shoreline database is made up of 200-plus layers of information. The mapping capabilities will frustrate the seasoned mapper, but for us rookies, it is a great, free option.

Using a freeware program called shp2mie any shapefile can be quickly converted into Marplot's mie format. This really opens up a world of mapping opportunities. Every map I construct is worked on in Marplot. Every database I encounter, ultimately is reformatted so that I can import it into Marplot. It is a mapping package that allows the neophyte mapper to try their hand at the mapping art with minimal frustration.

I have lots of data in Marplot's mie format. In fact too much to list. If you have your own unique dataset, I could reformat it to work in Marplot.

I am discussing this mapping package and it's capabilities, because this site gets a number of inquiries about Marplot compatible data files. I know the US county-level TIGER files will import directly into Marplot, but almost all other data needs to be reformatted. My favorite reformatting package is Global Mapper. It handles almost every type of mapping format and converts them easily to a Marplot compatible format. If you have questions specific to Marplot capabilities, I'll be glad to try and answer them for you. It is a solid beginner mapping package. Give it a try.

Enjoy!

Monday, October 29, 2007

Thoughts - Vector Map Files or Raster Images, Does It Really Matter?

Isla del Coco - EEVS Map (1-50,000)

EEVS Map Using Vector Files


Isla del Coco - EEVS Map (1-50,000)

Raster Image of EEVS Map

Most of you just like to look at the island images. Perhaps you are an armchair traveller or the boss is giving you the "what for" all day and this site kind of looks like work so you visit. Maybe you are homebound and this is your way to travel. It is all cool!

Some of you are cartographically inclined. You work with maps and mapping during the day and viewing this site either inspirers you or reminds you how accomplished you are at this mapping art. Some of you just dig maps. You never met a map you didn't like, except for some of my earlier efforts. Some of you visit this site because you actually searched for a particular topic and the "EVS-whatever" link looked interesting. Hopefully, you found the information you needed. It is all cool!

I am hoping that some of you are folks like me, map makers. Not just map viewers, but people who like to fashion a map. You have a mapping package installed and your hobby, your job, your passion is to make quality maps. To all of you - are you interested in my completed vector map files or not? The last two posts I provided links to vector map files that will allow a person with a mapping package to reproduce Isla del Coco and the Smithsonian Global Volcanism Point File. If I am visiting my site and I have my mapping passion, I would download and install these vector files. I would want to see them in action. Knowing what I know about vectors versus raster images, I would be all over the vector files. Don't get me wrong, I would download the raster images and check them out as well. But the vector files would be a bonanza. But that is me and I am curious. How many viewers share my passion, curiosity and appreciation of a quality vector data file, especially one of an island? Are there others that download these files or do I post them for no one? It takes an additional couple of hours to prep the various layers of information that make up one of my island projects. If enough of you take advantage of the service, I'll keep it going. If not, I'll not. Either way, it is all cool!

Enjoy!

Sunday, October 28, 2007

Data - Simthsonian Global Volcanism Point File

Smithsonial Global Volcanism Point Data File

Anybody need volcano location data? I have had this data in MS Excel format for over a year. One of those "this looks interesting" data sets. But I was busy with other things and never got around to mapping the data. Well, I went after it today and have it mapped and available in Shapefile format. That's right, FREE stuff. My Volcano Point File consists of all of the data in the original file with a slight modification - lon/lat are placed in the first two columns for mapping purposes.

Volcano Point File

So all of you data-hounds, have fun with the Smithsonian Institution Global Volcanism Point File.

Enjoy!

.

Saturday, October 27, 2007

Isla del Coco CS - Treasure Island

Isla del Coco

1) The first image is DigitalGlobe's (DG) coverage found in Google Earth (GE). Using GEs Path Tool, I digitized over 3/4 of the islands shoreline. The digitized shoreline from a DG image is considered to be EEVS precision, meaning scales below 1:12,500 is routinely possible. Once I had completed my GE phase of this project, I saved the completed EEVS shoreline with cloud-obscured gaps identified for later work. I was able to then load this KMZ file into Global Mapper (GM)

2) The balance of the shoreline was digitized using WRS imagery, specifically those identified as path 016 row 056. The imagery is packaged in 257MB TAR files. Once downloaded and unzipped, one can select from a number of TIFF images. I used nn40 tif image.

3) With the shoreline complete, I systematically added layers of information (name labels, land polygon, streams, contours). The SRTM image, N05 W088, served a double purpose. First, I was able to use GMs "Generate Contours" routine to create contours. In addition, The SRTM image was used to create a shaded relief image of Isla del Coco.


Isla del Coco - Island Image

Isla del Coco - Island Image Georectified JPG

Now for some data for all of you with mapping packages. I have zipped 9-layers of data that makes up the vector files for this project. The layers include: shoreline, streams, contours, name labels. Using GM, the zipped shapefiles load in about 2-seconds.

Isla del Coco - Vector Shapefiles

The second package contains a georectified JPG imag of the island and a DEM formatted file of the island. It should be loaded first with the JPG draped over it. You can do some neat 3D work with this combination of images.

Isla del Coco - Georectified JPG and DEM Files


Isla del Coco - 3D View SW to NE

Isla del Coco - 3D View SW to NE

If you load it with various vector layers, you can see them draped over the landscape of Isla del Coco.

Now for the "Treasure Island" stuff. According to Wikipedia, there are at least 3 treasures buried on this island. Pirates used the island as a hideout for years. Supposedly, Robert Louis Stevenson used Isla del Coco as inspiration for Long John Silver's Treasure Island.

Enjoy!

Wednesday, October 24, 2007

North Sentinel Island IN - The Most Isolated People and They Like It That Way

North Sentinel Island - Landsat ETM+ Image Pre-2004 From Google Earth (1-62,500)

North Sentinel Island - Landsat ETM+ Image Circa 2000 From Google Earth (1:62,500)


North Sentinel Island - ESA Image 2004 (1-62,500)

North Sentinel Island - ESA Image 2005 (1-62,500)

Let's begin this post with a discussion of my two base images. The first one is a modified Landsat ETM+ extracted from Google Earth. I have the Landsat ETM+ image found on N-46-10_2000 and used it for one of the vegetation layers found on my completed map. However the shoreline, sand beach and forest was extracted from the Google Earth image. Both of the above images were georectified to my N-46-10_2000 image. The Landsat image is circa 2000. The ESA image was taken following the devestating December 2004 earthquake and tsunami. The offshore reefs underwater in the circa 2000 image are uplifted. They were raised as a direct result of the 9.0 earthquake. The island was also hit by the series of tsunamis that created such death and destruction throughout the region.


North Sentinel Island - EEVS Map (1-62,500)

North Sentinel Island - EEVS Map (1:62,500)

My map displays both shorelines of North Sentinel Island. The enlarged beaches and submerged reefs are parts of the new shoreline. The island proper was mapped at scales between 1:12,500 to 1:6,250. The new shoreline and raised reefs were mapped at a scale of 1:50,000. The map is a nice effort. It looks good and reflects the effects of December 2004.


Sentineli ShootIng Arrow at Helicopter

Sentineli Man ShootIng Arrow at Helicopter

I want to say a few things about a group of people that call North Sentinel Island home. They have called it home for about 60,000 years. They are a remnant of the original "out-of-Africa" movement around 100,000 years ago. Follow this link to the Andaman Association and their fascinating site about the Lonely Islands (Andaman Islands). George Weber has gathered information about the inhabitants of the Andamans and specifically the people inhabiting North Sentinel. This group wants nothing to do with the outside world. The population estimate is about 250 individuals. The picture, taken from the Andaman Association website shows the Sentineli's defiant attitude. After the December 2004 earthquake and tsunamis, the Indian government sent a group of concerned scientists to North Sentinel to check on the well-being of the inhabitants. The heli was greeted by the lone man attempting to shoot the big bothersome machine out of the sky. The Sentinelis are doing just fine and they could care less about the world and all of its mysteries. I hope they are able to survive, if only to remind us of that different way we all once worked with nature which is so different from our attempts to mold and control nature today.

Enjoy!