Friday, November 30, 2007

Comparison - Google Earth Georectification vs Landsat ETM+ Georectification. Who is Right?

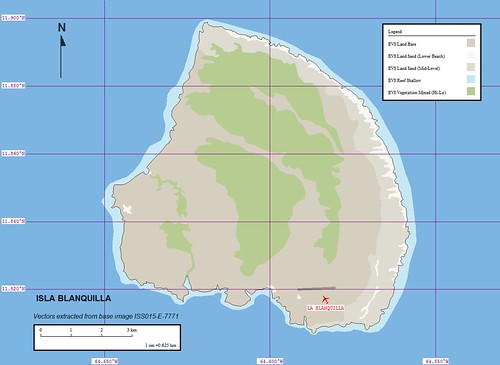
My previous post elicited a question asking which image was georectified properly and wondering if I had verified the projection. I am a trusting soul and if, in the instance of my previous post, the NGA PGS vector coordinates are what I used to georectify the ISS image. I am reasonably confident the ISS image fit precisely into the NGA PGS vectors. Ultimately the ISS image I fashioned used a Geographic (latitude/longitude) projection with WGS-84 datum.

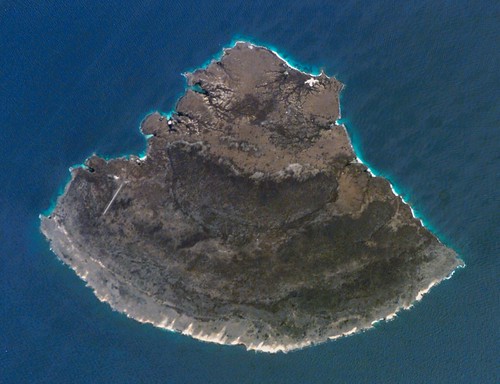
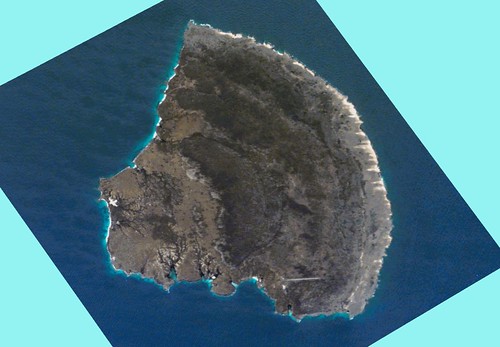
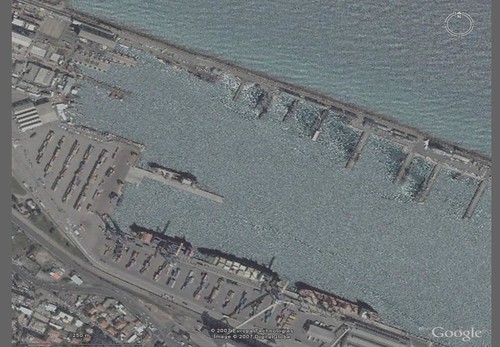
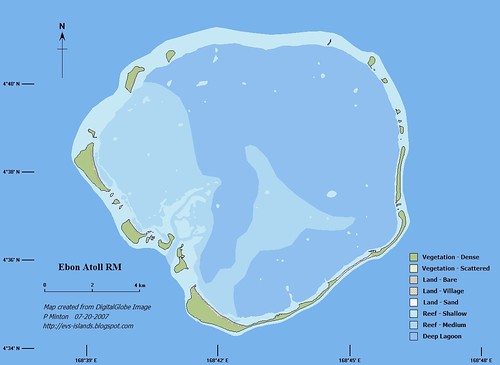
This evening I loaded the Landsat ETM+ orthorectified mosaic N-20-10_2000, which includes Isla Blanquilla, into Global Mapper. It loaded quickly. I zoomed into Isla Blanquilla at a scale of 1:62,5000, which was the scale of my final map project. I then loaded the ISS georectified base image of Isla Blanquilla on top of the Landsat image. It is right on! A precise fit. However, yesterday when I attempted to create an overlay of the ISS image in Google Earth and after spending 15-minutes stretching and twisting the image, it never quite fit. It was alway alittle off.


GE to Landsat Rectification Offset

Google Earth to Landsat ETM+ Georectification Offset

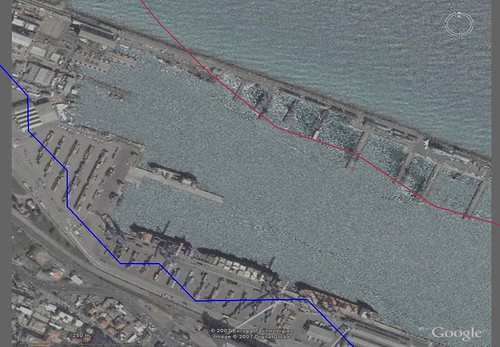
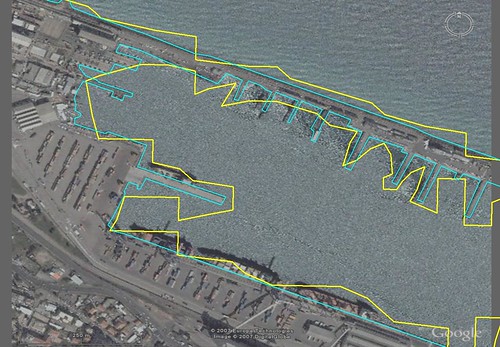
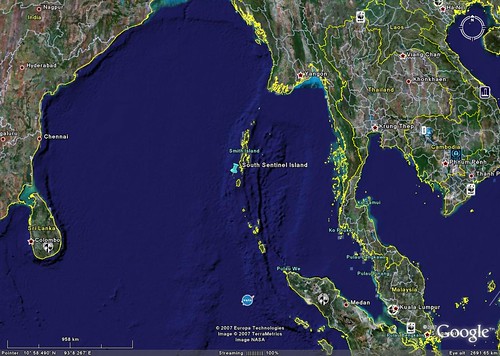
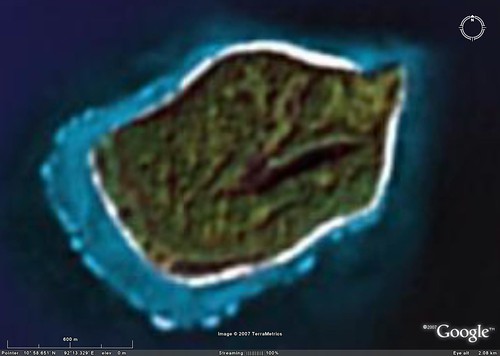
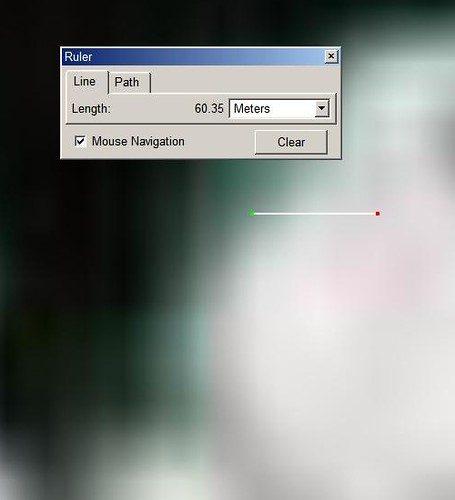
This evening, I recorded the lat/lon location of three relative ground control points within Google Earth and in Global Mapper's Landsat display. They each showed the same image of Isla Blanquilla and supposedly at the same location. Each relative ground control point was easily discernible. After recording lat/lons for each point and determining the difference, it seems someone is off anywhere between 2-meters and up to 63-meters for this single island. So, who is it? Who has misplotted this island? Is it Google Earth or Landsat ETM+? Care to guess?

Enjoy!

Isla Blanquilla VE - ISS Island Image Transformed into EVS Precision Map

Isla Blanquilla - ISS015-E-7771 Image

Isla Blanquilla - ISS015-E-7771 Image

A few days ago Earth Observatory carried this image of Isla Blanquilla and an interesting article about this small island located NE of Caracas Venezuela. Granted, if you are a US citizen, it is probably not your first choice to visit on a leisurely vacation due to the strained relations between our two countries, but the ISS image is pristine and details are mappable compared to the partially cloud-obscured Landsat ETM+ image. DigitalGlobe has never snapped a pic of this island either. So, I made do with the ISS image and created my map over a 4-hour period.


Isla Blanquilla - ISS015-E-7771 Georectified Image (1-62,500)

Isla Blanquilla - ISS015-E-7771 Georectified Image (1:62,500)

In order to use any non-georectified imagery, one must georectify it. I use Global Mapper to georectify. I loaded NGA PGS shorelines of this island (Region 14). These shorelines are very close to Landsat ETM+ shorelines. I selected 4 easily definable points on both my loaded shoreline line file and on my ISS image. It took about 10-minutes, with most of the time spent watching TV. Once the image was georectified, I began the task of digitizing the island shoreline, lower beach, upper beach, bare island, hi-low vegetation, airfield and the shallow reef surrounding the island.


Isla Blanquilla - EVS Marplot Map (1-62,500)

Isla Blanquilla - EVS Marplot Map (1:62,500)

Once the digitizing was completed, I imported the completed layers into Marplot, where I still do much of my preliminary map construction. I am just used to working with it. I defined each layer and assigned it to pre-existing EVS layers. I did a quick layout of map titles, legend, scale and north arrow. Done!

At this point, I typically post. One day when I am given the opportunity and the time, I will "fancy" up my map using ImageForge prior to posting. Until that day arrives, this is as good as it gets.

Enjoy!

Monday, November 26, 2007

Data - Global GSHHS Land Mask in SHP Format

Global Land Mask

Global Land Mask using GSHHS Modified WVS

For all of you requesting the Global GSHHS Land Mask in shp format follow this link and you can download a copy. The file is 66MBs.

Enjoy!

Sunday, November 25, 2007

Comparison - Haifa Harbor Using 1:2000000, 1:250000, NGA PGS and EEVS Precision Shorelines

Haifa Harbor - DigitalGlobe Image from Google Earth (1-4,600)

Haifa Harbor - DigitalGlobe Image from Google Earth (1:4,600)

Let's begin this comparison of shoreline accuracy by superimposing four shorelines onto a 1-meter resolution image of Haifa Harbor. Why Haifa? Just because I happened to be making a land-sea mask in this part of the world. My initial study focused on using NGA's Prototype Global Shorelines (PGS) created from Landsat ETM+ imagery. As you will read and see this global shoreline is one of the most detailed available. It does have a few negative considerations, like "stuttering" shorelines, non-mapping of water-inundated land (swamps, marshes, etc.) and hand-tracing of shorelines is more accurate than the software generated shorelines...but, that said, NGA PGS shoreline is a great first-step toward a global shoreline for all of us.


Haifa Harbor - 1-2,000,000 (Red) and 1-250,000 (Blue) (1-4,600)

Haifa Harbor - 1:2,000,000 (Red) and 1:250,000 (Blue) (1:4,600)

The 1:2,000,000 (Red) shoreline is, by virtue of it's name, designed to be used at 1:2,000,000 or smaller resolutions. It works well for coarse shoreline delineation to get "an idea" of where the shore ends and the sea begins. The 1:250,000 goes by the acronym W(orld) V(ector) S(horelines). It was originally extracted from Tactical Pilotage Charts. It gives one a useful shoreline for a wide variety of projects. However, when one pushes it beyond 1:250,000 it quickly proves inaccurate in tracing the actual shoreline.


Haifa Harbor - NGA PGS (Yellow) and EEVS Precision (Lite Blue) (1-4,600)

Haifa Harbor - NGA PGS (Yellow) and EEVS Precision (Lite Blue) (1:4,600)

Now for the good stuff! The NGA PGS precision shorelines do a fairly good job of tracking the actual shoreline. They are deemed appropriate at scales between 1:125,000 to 1:250,000. Some areas could be pushed to 1:62,500, but be careful. I am careful and I push them below 1:62,500, for digitizing purposes, in order to confirm my Landsat derived hand-made vectors are of greater precision than the PGS. And mine are! For the purposes of this comparison the PGS shorelines would give a person an accurate shoreline impression as long as it was not superimposed over the actual shoreline. The lite blue line is what I call E(xtremely) E(nhanced) V(ector) S(horelines). They are derived from DigitalGlobe's 1-meter resolution imagery found in Google Earth. Oh, that all the world were imaged at 1-meter cloud-free resolution. I feel that is a long way coming and I don't think the global shoreline vector files derived from them will be free. I suspect they will be quite costly.

Back to the land-sea mask, or what started this current study. The most accurate vector based global land-sea mask is mine. I call it GSHHS Derived Global Land-Sea Mask and you can download a copy here. Be forewarned, the file is 83.9MBs zipped and 340MBs unzipped.

The most accurate future global shoreline map should be the NGA PGS precision product, but it needs work to finish it (correct stutters, map non-mapped areas, etc.). Once it is finished, it will be THE GLOBAL SHORELINE. Until then, WVS rules.

Enjoy!

Friday, November 23, 2007

Data - Global Land Mask using Vectors instead of 1-Kilometer Grid Cells

Global Land Mask

Global Land Mask using GSHHS Modified WVS

Regular readers know that I am a long time user of World Vector Shorelines (WVS). These vectors cover the world at a scale of 1:250,000. If you download them, you will see that they are not polygons, but line files. I have always wanted to create a land-mask of all land areas within this database, but have never had the time, software or computer calculating power. That was until yesterday. A reader asked if I knew whether their was a land-sea mask at better resolution then the 1-kilometer grid cell version currently available. To tell the truth, I didn't know about land-sea mask maps. After a brief search of some of my sources I found out that the main global land-sea mask was something build back in 1996 using WVS. Instead of using vectors as the deliverable, the builder fashioned the 1-kilometer grid map.

I let my reader know that the 1-kilometer global land-sea mask he currently was using was, probably, the best going. He knew of the Globcover LULC 300-meter grid cell version coming out in the first part of February 2008 to be created and made available by ESA.


Global Land Mask - Eastern Canada and US

Global Land Mask - Eastern Canada and US

Curious soul that I am and having time, software and computer capabilities, I decided I would create my own global land mask. I loaded the land files taken from GSHHS, a modified version of WVS, into Global Mapper. Using a simple routine within the digitizing tools, I created polygons from lines. Simple process, but very long processing time. Eurasia took over 4-hours to process. After working at it all day and night, I came up with my vector version of a Global Land Mask. The entire file is 340MBs in size (84MBs zipped). It takes about 3-minutes to load into GM, but wow! It does look pretty cool.


North America Land Mask from GSHHS (1-125,000)

Global Land Mask - San Diego with 1-kilometer grid cell (1-125,000)

The above image is at a scale of 1:125,000 (1-inch to 2-miles). The 1-kilometer grid cell is placed on the map to give you an idea of the coarseness one gets using the existing global 1-kilometer grid-cell map. Even though it was derived from WVS vectors, not using the power of vectors (infinite zooming capabilities) one encounters an unnecessary coarseness not evident in the vector-based product.

I think my vector-based product is an example of a wonderful land-sea mask.

Enjoy!

Monday, November 19, 2007

Starbuck Island, KR - Tough Little Island

Starbuck Island - DigitalGlobe Image from Google Earth - 13 Tile Mosaic with Ocean Fill

Starbuck Island - DigitalGlobe Image from Google Earth - 13 Tile Mosaic with Ocean Fill


Starbuck Island - EEVS Precision Marplot Map (1-50,000)

Starbuck Island - EEVS Precision Marplot Map (1:50,000)

This island was a challenge to digitize. Working off of my 13-tile Starbuck Island DIGM (DigitalGlobe Image Mosaic) and using Global Mapper digitizing tools, I spent Saturday, Sunday and Monday completing my map. The best view for this map comes from selecting it and looking at the full size image in my Flickr account. This map is a semi-fancy composition. To completely fancy this map would take another 2 to 4 hours and I wanted it posted instead of fancied.


Starbuck Island Interior AKK_075

Starbuck Island's Interior (AKK 075, PBIF Photo)

I hope my map gives one the same message as this picture (see photo credits) of Starbuck Island's interior. The plants you see in the foreground are "sticker" bushes. This is a desert island. The location is such that it gets very little rainfall. But the little island continues - it is a tough little island.


Starbuck Island's Forest - DigitalGlobe Image in Google Earth

Starbuck Island - The Forest

Along the northwest shore is the Starbuck Island forest. It consists of 22 palm trees. I suspect that if these grow more will be planted.

Enjoy!

Wednesday, November 7, 2007

Ebon Atoll RM - One More Look At A Quality Map

Ebon Atoll DG Image Complete

Ebon Atoll - DigitalGlobe Image from Google Earth (1:80,000)


Ebon 80 LL scale

Ebon Atoll - EEVS Marplot Map (1:80,000)


Ebon 80 clr

Ebon Atoll - EEVS Map Clear Version (1:80,000)


Ebon Atoll RM - EEVS Map Final Version (1-80,000)

Ebon Atoll - EEVS Map Final Version (1:80,000)

The final map in this series of images is what I would like to be able to consistently produce. It was compiled at 300 dpi size using ImageForge software. The problem I face is one we all share - great objectives, not enough time. A critical key to my map-making avocation is to either get funding so that I can make MY ISLAND MAPS all of the time or retire and make maps. The first option hasn't happened yet, but I always have hope. The second option is still a few years away. So, I just do what I am able to do and make as many maps as my busy life will allow. Enough about me and my "Oh, Woe is me!" situation.

These images were part of a project I completed in July 2007 while on vacation. The first post was Ebon Atoll RM - Preliminary Maps and the second was Ebon Atoll RM - Fancy Map. I took both the clear Marplot map and the Lat/Lon Marplot map, using ImageForge, I added the finer details that I desire for my completed map projects. The final product, fancied up in ImageForge, is a far superior presentation compared to the Marplot product.

Given time - all of my island mapping projects should be of this quality. Anybody have any extra time I can use?

Enjoy!

Friday, November 2, 2007

South Sentinel IN - Uninhabited Tropical Paradise If You Can Deal With Mosquitos, Coconut Crabs and No Fresh Water

South Sentinel Island - Locator Map

South Sentinel Island - Locator Map


South Sentinel Island - TerraMetrics Image from Google Earth (1-9,000)

South Sentinel Island - TerraMetrics Image from Google Earth (1:9,000)

A few days ago I completed a mapping project of North Sentinel Island. During the research phase, I learned that there were two Sentinel Islands - North and South Sentinel. South Sentinel is about 160 hectares in size. There is an abandoned lighthouse on the island. Other than the lighthouse, no other human marks are on this island. The v-shaped dark area is a periodic swamp. At low tide it is dry, at high tide it is full of salt water. According to a hearty traveler that spent 10-days on the island back in 2000-something (before the earthquake and tsunami), the island can be alluring, if one can repel the mosquitos, avoid the coconut crabs that could pinch a human leg off, and a few other challenges this small island throws at you (no fresh water save the rain). The article is an excellent read and it will either entice you to dream of a visit to this small island or cause you to relish life in your safe home. You know, the one with running fresh water, plumbing and a 'fridge full of midnight snacks.

Enjoy!

PS - Since the 2004 earthquake and tsunami, South Sentinel Island has undergone significant reshaping. Reefs are above water that were below water before and one of the beaches is now underwater. I have no images of the island showing the new shape.