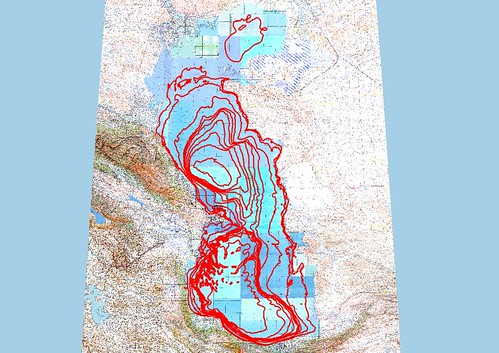
King George Islands FP
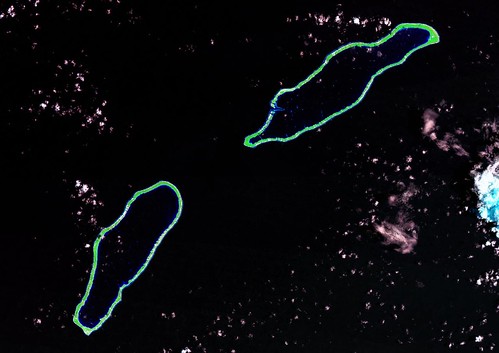
King George Islands FP - Landsat ETM S-06-10_2000 Image (1:175,000)
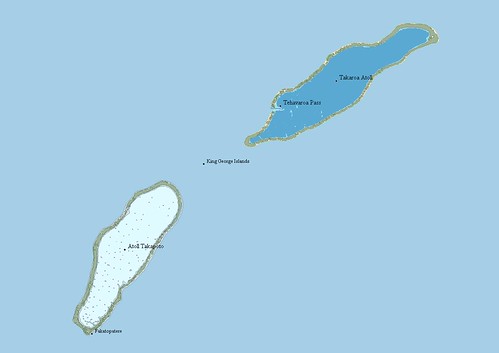
King George Islands FP - EVS Precision Map (1:175000)
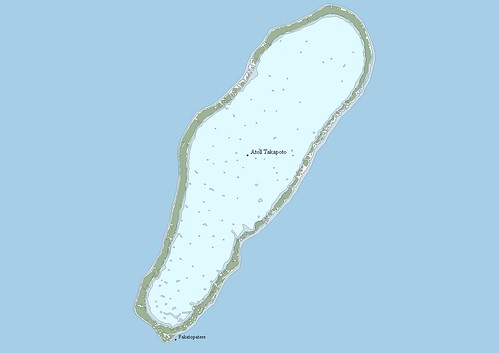
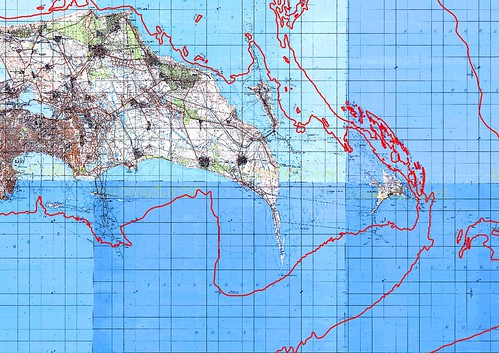
Takapoto Atoll FP - EVS Precision Map (1:80,000)
I spent today digitizing the King George Islands located in the Tuamotu Islands FP. The top atoll, Takapoto, was just completed using my new NIMA color scheme. Not only am I limiting layers to EVS island projects to island polygon, reef shallow, lagoon and island water feature, but I've changed my color scheme to match NIMA's nautical charts. My current color scheme is as follows:
island polygon is R-245 G-245 B245
reef shallow polygon is R-205 G-225 B-235
lagoon is R-225 G-250 B-255.

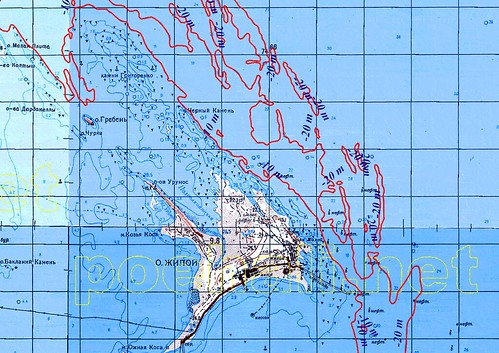
Takaroa Atoll FP - EVS Precision Map (1:80,000)
Takaroa Atoll, completed a few months ago, contains my old color scheme:
island polygon is R-240 G-232 B-217
reef awash is R-208 G-234 B-224
reef shallow is R-153 G-214 B-236
lagoon is R-090 G-169 B-211
In both projects the vegetation layer R-157 G-179 B-151 and the deep ocean layer R-165 G-207 B-231 are unchanged.
For visual appeal, I like the old style. The NIMA nautical chart style gives a cleaner, crisper look. What do you think?
Enjoy!