Sunday, March 30, 2008

Bugaia Island UG - One of 3,000 Islands


View Larger Map

Bugaia Island - Landsat ETM+ N-36-00_2000 (1-50,000)

Bugaia Island - Landsat ETM+ N-36-00_2000 (1:50,000)


Bugaia Island - EVS Precision Map (1-50,000)

Bugaia Island - EVS Precision Map (1:50,000)

Bugaia Island is one of at least 3,000 islands located in Lake Victoria. Not much information on this relatively small island. For those of you that would like to learn about the ecosystems that make up Lake Victoria follow this link. Otherwise, what you see is what you get.

The mapping took about 1-hour to digitize and another 3-hours to pretty it up. This map is significant in that all of the pretty work (legend, lat/lon, labels) were done in Marplot. All in all, this is a nice looking map of a small lake island.

Enjoy!

Saturday, March 29, 2008

Titan's Unnamed Methane Sea - With Fixed Lat / Lon

Titan's Unnamed Methane Sea

Titan's Unnamed Methane Sea

Got to go to my grandson's baseball game. Will explain this when I get back. The map's lat/lon is corrected based upon feedback.

Okay, I'm back. The game was fun, I shopped for vinyl records and am ripping a copy of the soundtrack for the movie The Commitments (great soul music). Now I can explain my fixed map. Jason Perry, of the Cassini Imaging Team and a Titan map maker posted the following comment to my original post explaining lat/lon on this extraterrestrial body:

O° West is straight down. For worlds like Titan, longitude is defined as degrees west from the average Sub-Saturn point. In the map you show, 0° West is straight down, and longitude increases to 360 W in the clockwise direction.

Keep in mind that the sea you mapped is the smaller of the two main northern seas. The one to the west, seen in the radar image in two places: the northern part of the sea with the large island in the middle, and part of the middle of the sea to the lower right in PIA10008 as posted here.

As a result, I adjusted the longitudes by adding 180° to each of my original longitudinal lines.

Enjoy!

Thursday, March 27, 2008

Banaba Island - Freedom For The Banabans


View Larger Map

Banaba Island

Set These People Free! They got shoved off of their island back around the turn of last century, because they wanted the British, New Zealand and Australian interests to stop extracting phosphate, derived from bird guano, from their island. They got the old colonial wham-doozie! A contract that they didn't understand, a deal that gave away their island resource for next to nothing, a forced evacuation and after their island had been brutally plundered and not repaired, they were allowed to return. Just recently the courts awarded them $10 million for the past injustices - a mere pitance for all that they have been subjected to. There are a couple of web sites that tell their story: Abara Banaba, Wikipedia article and streaming video of a fly over of the island by Greenpeace.

The map was digitized within Google Earth using DigitalGlobe imagery and ultimately constructed in Marplot. I spent the last six to eight hours working on this relatively small island, but I learned alot while working on it. It is my first island I attempted to digitize all visible buildings. I think I did an excellent job.

What got me started on this particular island was the British Hydrographic Office Catalog of Nautical Charts. They publish a 1:50,000 scale chart (HO 979) of the island proper. This seems to me to be too large scaled to be of real use. In addition, they have a chart showing harbor details at 1:12,000 scale. I personally like my 1:3,125 view of the harbor. Also their chart was originally constructed in 1884 and updated in 1964. My data is from DigitalGlobe imagery gathered in the last couple of years. However, their charts are designed to be used by boaters, mine are not. I make maps, very nice maps, but just maps.

I couldn't leave well enough alone. I added a fourth image, a Marplot map at 1:20,000. The colors have been changed, a text box with appropriate credits is added, a nifty North Arrow and contours at 5-m intervals. I like the new look. One can soften colors too much. The colors used on this map are a bit bolder to draw attention to the features they depict.

Enjoy!

Saturday, March 22, 2008

Lindisfarne Island UK - Holy Island

Lindisfarne island -InfoTerra Ltd and Bluesky Image from Google Earth

Lindisfarne island -InfoTerra Ltd and Bluesky Image from Google Earth


Lindisfarne Island - EEVS Precision Map (1-20,000)

Lindisfarne Island - EEVS Precision Map (1-20,000)

As a college freshman, many years ago, I studied the impact of this island on Western Christendom. Sts Aidan and Cuthbert's early efforts at sustaining the Christian missionary efforts into England were important players toward it's eventually widespread acceptance. Some of us celebrate their efforts, others curse them. So goes the world. If you want more information on Lindisfarne Island follow this link . Let me talk about the base image and map.

The base image is a mosaic extracted from Google Earth using Infoterra and Bluesky imagery. It gives one a cloud-free view of the island. Maybe, too clear an image. I realize that this area is subject to major tidal flows. At times the island is an isolated island with both the causeway and surrounding sands under water. Other times the island is an extension of the shore. I believe the imagery captures the land-linked island.

I intend to make a couple of corrections and at least one addition to the map. Where the causeway links to the island is a stretch of shore that contains EVS Sparse Vegetation (Low). In this version of the map it shows up as EVS Land Bare. Also, I want to add an EVS Feature identification for Lindisfarne Island castle. I believe the map is initially a good effort and because it is vector based, one is able to zoom and modify to their heart's content.

It is nice to complete an island map. After all, that is what this site should be all about.

Enjoy!

Tuesday, March 18, 2008

Thoughts - Why Do People Visit This Site?

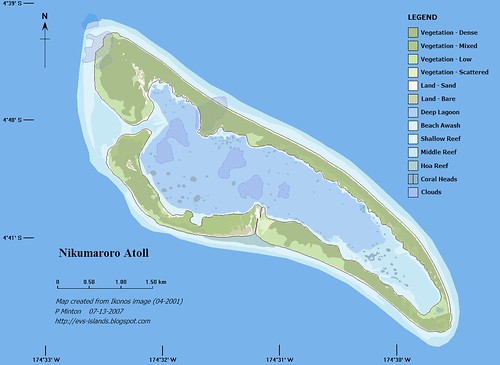
Nikumaroro Atoll KR - Marplot Map (1-30,000)

Nikumaroro Atoll KR - EEVS Precision Map (1:30:000)

Why do people visit this site? What is the attraction? Obviously, they come to look at maps. Not just any maps, but maps of islands. Why? Now that is the question.

I remember one of my joys in life was to spend Sundays browsing in the Scripps Institute of Oceanography map collection, which includes an extensive collection of nautical charts. I would spend hours pouring over those charts, dreaming of trips to those far-off islands. Trips that would most likely never happen, but it made difficult times in my life bearable. My chief regret was that I could not spend longer with the charts.

Now, back to my lead question - Why do people visit this site? I think they come to look at my maps of these far-away places to dream about their trips to them. Why else would someone from a bank in Japan look at maps of Greek islands or an employee of Boeing Aircraft check out the map of Nikumaroro Atoll? I believe that the overwhelming majority of people visiting my site are dreaming of islands to visit. They do recognize that my maps typically look pretty good. They are able to compare them to satellite imagery. Most could care less that the underlying metadata is not included, although I have it available. They just want a downloadable map that they can put into a folder named "Islands of the World" located on their computer desktop. When life begins pressing too much, they can check out that distant island and imagine how less complicated their lives might be if only they could spend time on their special place.

Enjoy!

Monday, March 17, 2008

Thoughts - You Tube Documentary "Tokelau: Still Afloat on the High Seas"

Tokelau: Still Afloat on the High Seas (part 1)


Tokelau: Still Afloat on the High Seas (part 2)


Tokelau: Still Afloat on the High Seas (part 3)

Interesting documentary on the effects of global warming on small islands, specifically the Tokelau Islands.

Enjoy!

Sunday, March 16, 2008

Comparison - Google Maps and Microsoft Virtual Earth Maps (Continued)

Let's be fair - My first Dual Map of Fatu Hiva Island, Marquesas Islands depicts hi-res vs 14.5-meter res imagery. Google Map (GM) has a Infoterra Ltd & Blue Sky hi-res image, whereas Microsoft Virtual Earth (MVE) has a colorized Landsat ETM+ mosaic. The comparison does not do MVE justice. MVE has great hi res image coverage in many places throughout the world. The above side-by-side allows one to view hi-res imagery from both mapping sources. At the center of the images is Lindisfarne Castle located on Lindisfarne Island, Northumbria, UK. For the researcher, working on a limited budget, one can easily compare the two images which appear to be taken at different times of the year (center image a few hundred meters west and look at the fields and see the shadows), at different hours of the day (see the shadows), most likely different cameras and under different atmospheric conditions. Research on the cheap!

Both imagery providers give one hi-res imagery at many locations around the world. Islands, however, are often under imaged. It is nice to see an island, such as Lindisfarne, with great, cloud-free coverage.

Enjoy!

Monday, March 3, 2008

Thoughts - More Marplot's Can and Can't Do's

Marplot Opening Window

Marplot Mapping Software
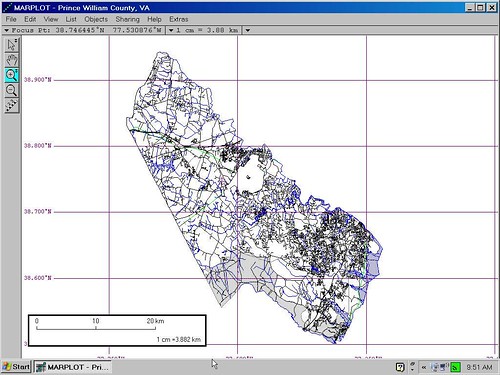

Marplot Map - Prince William County

Marplot Mapping - Census Tiger Data for Prince William County VA


Marplot Map Window

Mr MInton's World Shoreline Marplot Map

This post is a discussion of some of the things that one can do with Marplot, and they are many. This is not a discussion of how seamlessly Marplot works with the Census TIGER files. It is a discussion of Marplot's ability to hold a large number of vector and raster layers of information within a user defined map. My map is called World Shoreline and it currently contains 200-plus unique layers of information. Marplot allows me to switch layers on and off as I need them. I control the layer's range, color, line width, fill, and symbol. I can override my choices at any time and modify layer appearance. Marplot let's me take polylines and create polygons. In addition, it easily allows for the creation of islands of information within larger islands. Oh, by the way, it's free.

Marplot can import BMP, PNG, JPG and a few other raster image formats. However, direct import file options are limited to DAT file format (ARC Ungenerate), TXT file and MIE format (Marplot's own format). One can import SHP files using a freely available piece of conversion software called shp2mie. Marplot's digitizing features are functional, but limited.

I began using Marplot over 5-years ago. It was free and seemed to offer some useful possibilities. As I gained more and more experience working with it, I've come to appreciate the breadth of options available in it. It is a "poor man's" GIS package. I am aware of extremely robust Open-Source GIS packages. I have tried them and for my work they are too complex. Marplot is the ticket for me.

However, if I had to depend solely on Marplot as my digitizing software, I am quick to acknowledge that the quantity of my EVS Island maps would be a fraction of what I am able to currently produce due to the serious limitations of Marplot as a digitizing platform. My digitizing and raster image manipulating software of choice is Global Mapper. Global Mapper allows me to load a number of Landsat ETM+ images quickly and easily. Within seconds, I am digitizing shorelines. It has many additional features and is used by GIS professionals to accomplish quite demanding and complex mapping tasks.

I have tried other mapping packages, but I keep coming back to Marplot. Oh, well, as they say, "dance with the one who brought you." and Marplot maps are an integral part of every one of my EVS-Islands projects.

Enjoy!