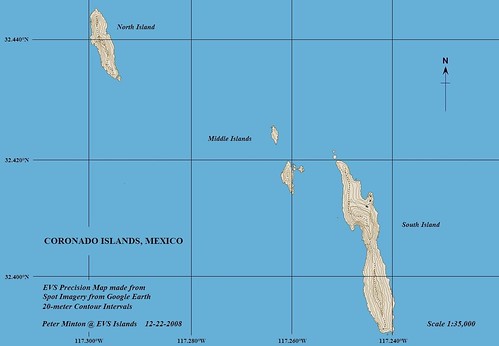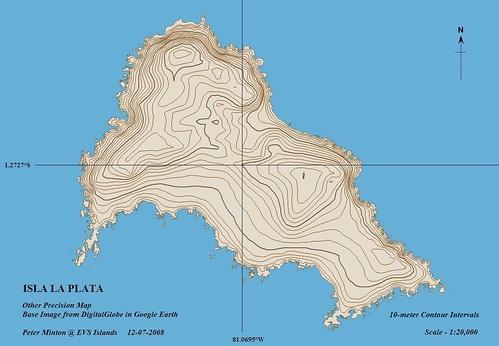
Isla la Plata - Other Precision Map (1-20,000)
Here is a comment and question concerning my use of SRTM data...
I am working on a similar project, in some aspects, about generating contours, and was wondering when the contours do not line up with your coastline (having 25 m intersect the shoreline of your polygon) do you alter the polygon or the raster data before generating the contours? Anyways, I think you work is beautiful, keep it up.
Here is my response...
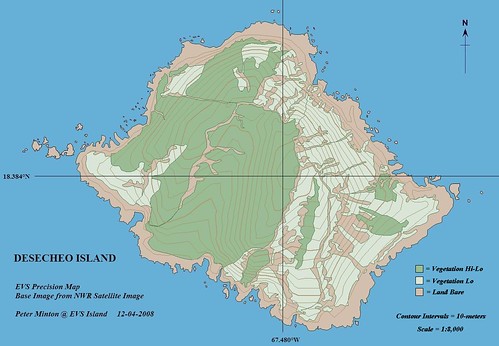
Thank you for your kind words. I love making maps of islands and to be able to add meaningful contours is a great benefit. However, my experience with the SRTM 30-meter and 90-meter data is as follows. After loading both a georectified image and an SRTM file into Global Mapper, I am able to quickly generate contours at an interval I deem appropriate for the scale I am working with. In nearly every instance the lower level contours do not conform to the actual imaged shorelines. I end up manually realigning the contours to best match the imaged shoreline. As a result my lower level contours are reasonable, but suspect.
When I am dealing with a very large void that cannot be handled by combining SRTM 30-meter with SRTM 90-meter data or be filled with existing void-filling software (I use SRTMFill), I end up guesstimating alignments of contours. Consequently, all of my maps containing contours are as good as the underlying SRTM data - sometimes excellent (upper elevations of Isla la Plata map) and less reliable (10-meter to 30-meter contours and northern contours due to a void).
I am not practiced enough to correct the underlying SRTM ASCII data, so I rely upon working with software (SRTMFill), imagery to contour reconciliation, or when cloud-obscured, an educated guess using secondary imagery.
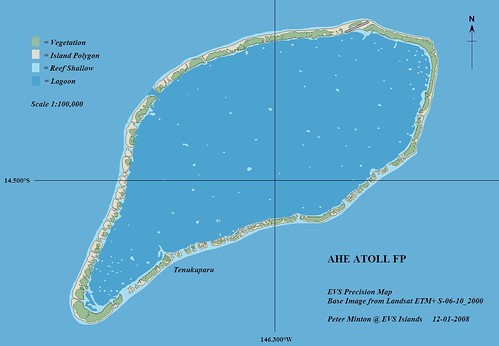
Hopefully, this answers your questions. Perhaps you have techniques or know of SRTM void-filling software that might correct many of my issues concerning misaligned or voided elevation data. I do believe that SRTM 30-meter and Landsat ETM+ at 14.5-meter resolution can work reasonably well together. However, combining SRTM 30-meter with 1-meter resolution imagery most often creates many slight, but consistent contour misalignments.
SRTM elevation data, as stated above, gives us a reasonable idea of the topography of the underlying land. I would use it to go hiking, but I sure would not bid a construction job based on it.
Enjoy!
 >
>