What is EPIP?
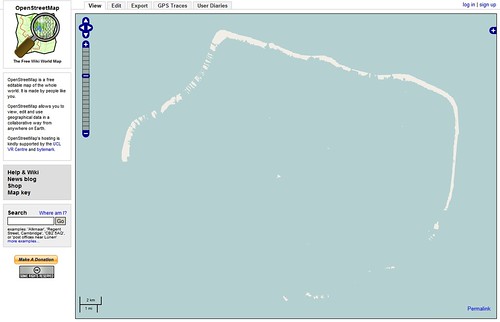
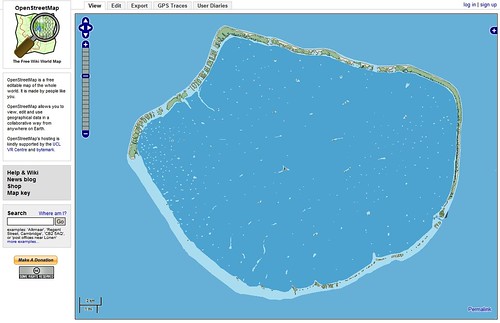
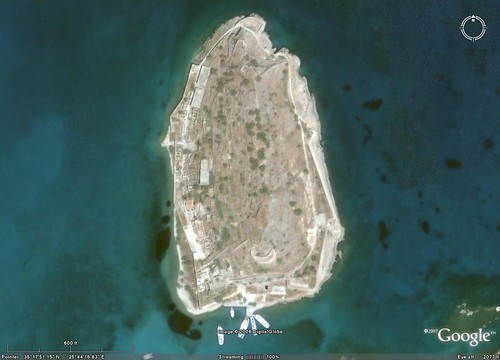
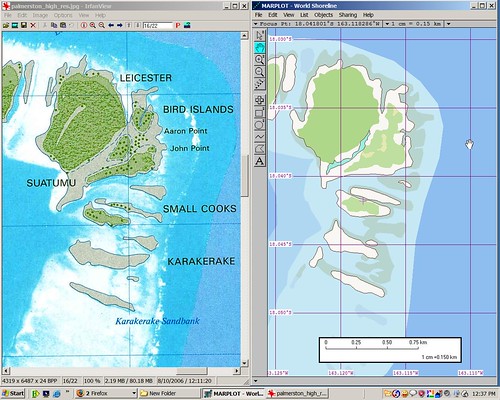
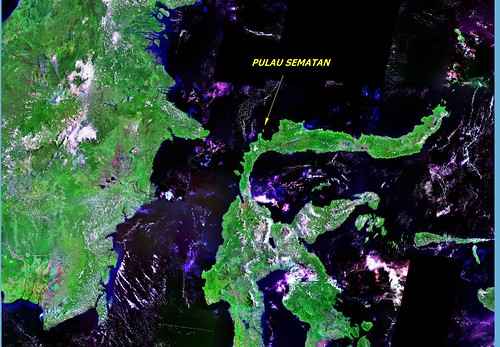
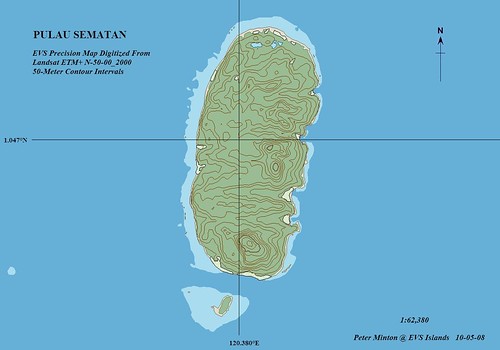
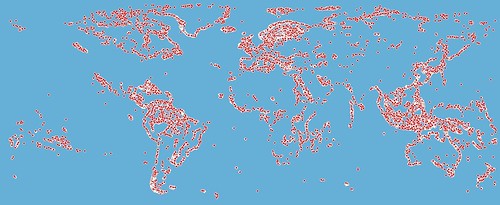
Enhanced Vector Precision Island Polygons - Using Landsat ETM+ ortorectified image mosaics as my base images, I digitize various layers of information, most typically from islands. I use Landsat ETM+ because: 1) It is free. 2) It is typically cloud-free. 3) It is consistent in quality. 4) It covers the earth. 5) It is virtually copyright free. This is the degree of precision over 8,000 South Pacific island polygons have been digitized to. This level of digitizing precision over such a broad expanse (South Pacific) is quite an accomplishment. What does this level of digitizing precision entail? What are the layers of information being captured?
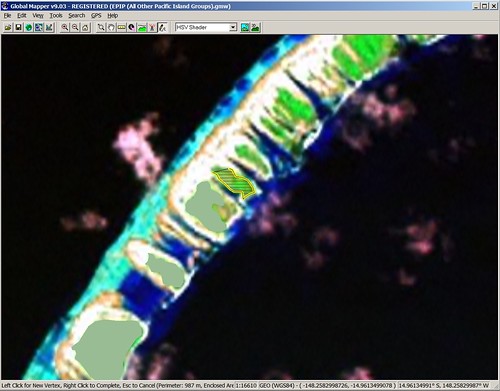
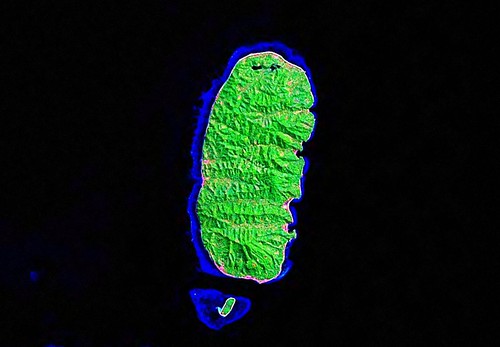
Atoll Digitizing - First Layer Vegetation (Hi-Lo)
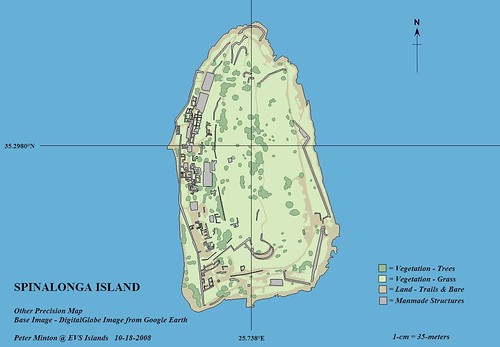
The first layer I digitize is vegetation. Working at a scale of between 1:25,000 to 1:15,000, I carefully digitize layer outlines. Working with the vegetation layer, I have been known to make a number of vegetation classifications. For the purposes of EPIP, I make one classification - Vegetation (Hi-Lo). This broad classification focuses primarily on land vegetation. I am reasonably certain I digitize some patches of reef vegetation as well.
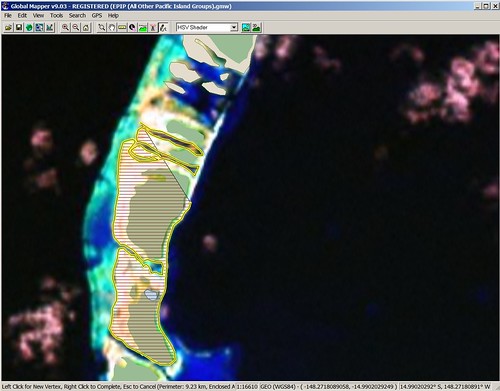
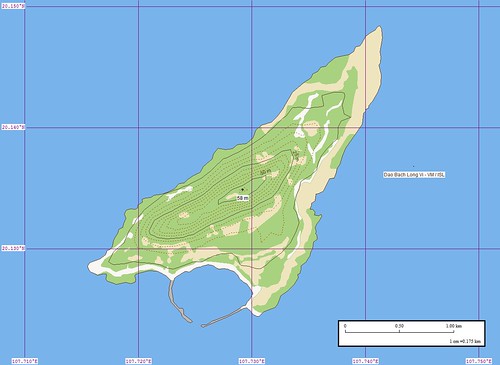
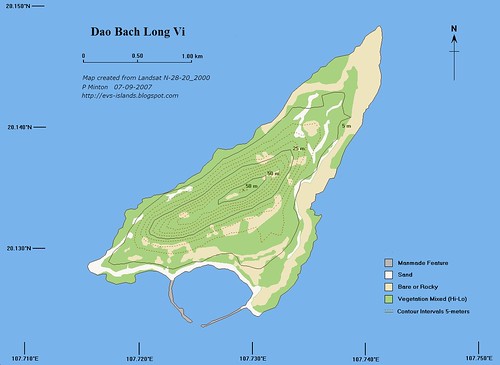
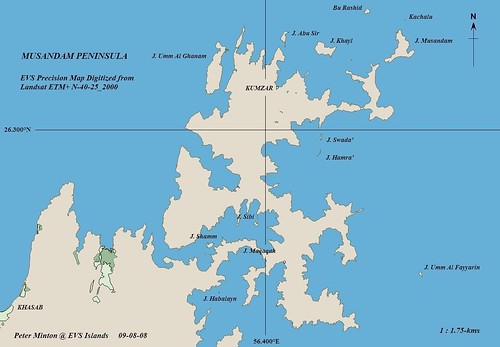
Atoll Digitizing - Second Layer Island Polygon
My second layer of information is the island polygon. As the name implies, this should be any above-water land feature. When digitizing an atoll made up of many small motus located on a complex reef that is often awash the difference between above-water, reef awash and below-water can get fuzzy. It is within this layer that I am certain I include reef features that are either awash or just below water. In this layer, I prefer to digitize too much as opposed to too little. Perhaps the next generation of Landsat imagery will allow for a clearer land vs reef determination. Until then, I'll digitize in as consistent a manner as possible.
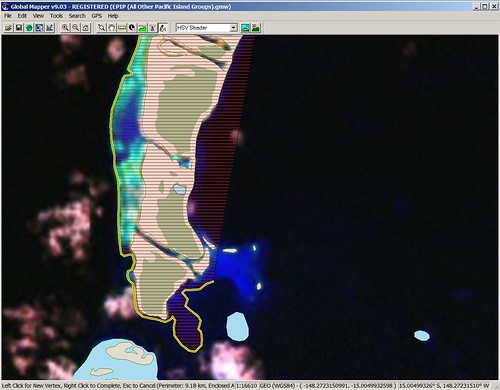
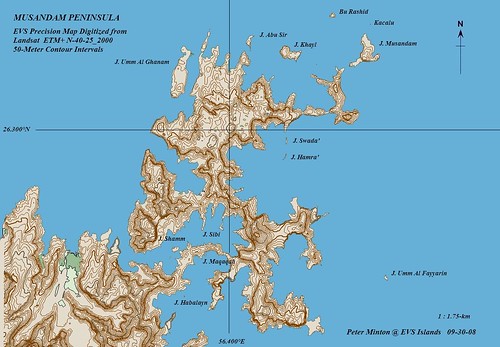
Atoll Digitizing - Third Layer Reef Shallow
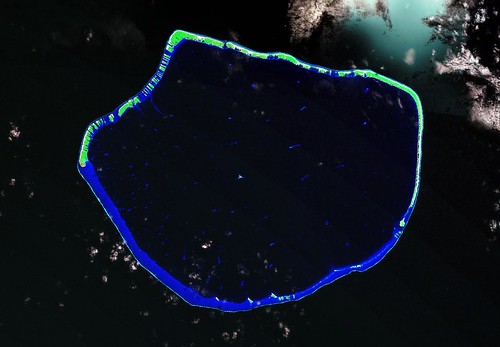
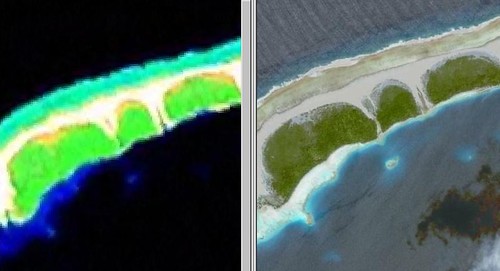
This is another layer that I have used a number of classification. For the purposes of EPIP, whatever is visible (shade of blue) that I have not classified as a island polygon, makes up my Reef Shallow layer. This layer on the outer reef edge is typically defined by waves and/or a faint blue area along the shore. The inner reef shore also contains this blue area in varying shades and thicknesses. All of these blue areas are classified as Reef Shallow for the puposes of EPIP.
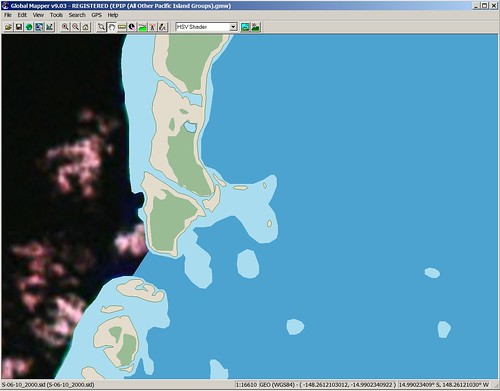
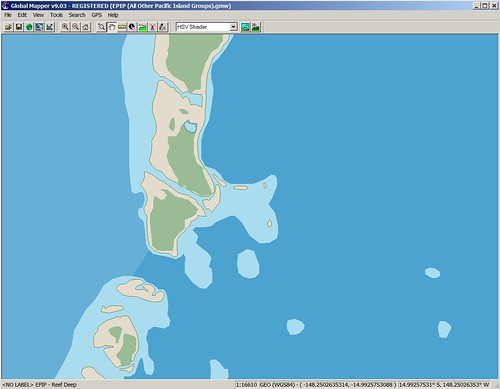
Atoll Digitizing - Fourth Layer Reef Deep
The final layer is Reef Deep or the central lagoon. It is basically everything within the atoll that isn't an island polygon or reef shallow. A crude classification, but it works well for EPIP.
I do all of my digitizing using Global Mapper. It is: 1) dependable 2) fairly inexpensive 3) simple to use 4) produces consistent product and 5) is serviced by Mike, absolutely the best customer service/owner of a product.
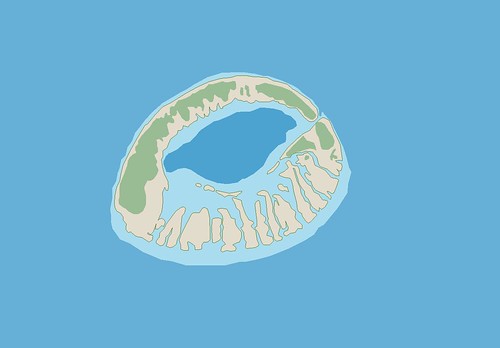
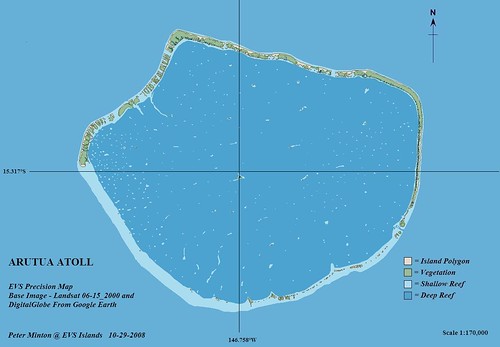
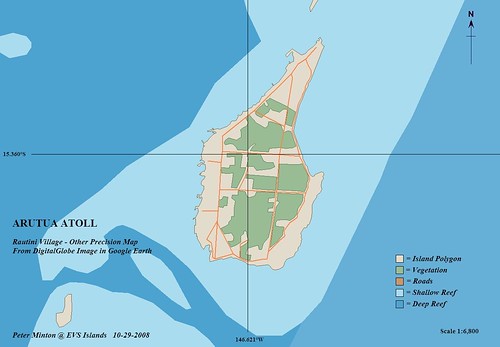
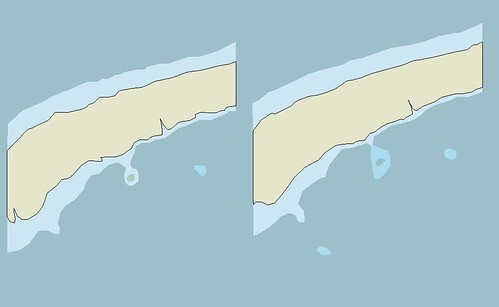
Atoll Digitizing - EPIP's Four Atoll Layers
And there you have it, EPIP's four atoll layers in all their glory. I'll share a few of my recently completed atolls with you. North is up and I realize they are unfinished maps without lat/lon, titles, north arrow and such, but they make the point, EPIP is a quality product.
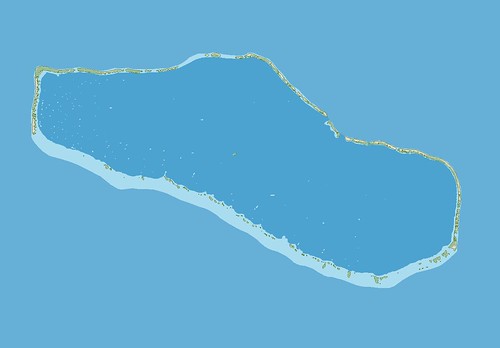
Tahanea Atoll - EPIP (1:200,000)
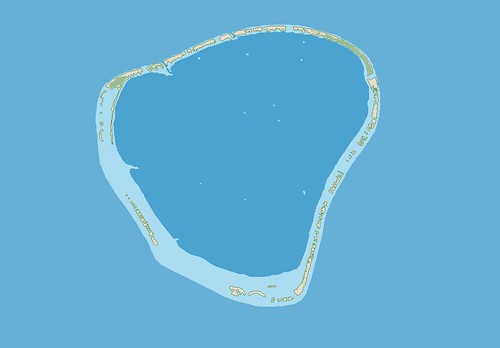
Motutunga Atoll - EPIP (1:100,000)
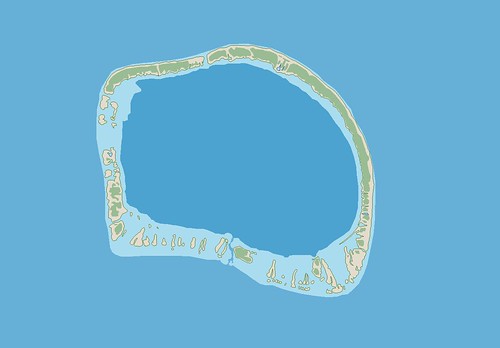
Tunake Atoll - EPIP (1:50,000)
Tepoto Atoll - EPIP (1:25,000)
Enjoy!