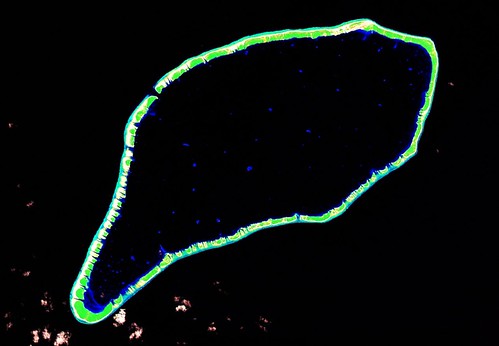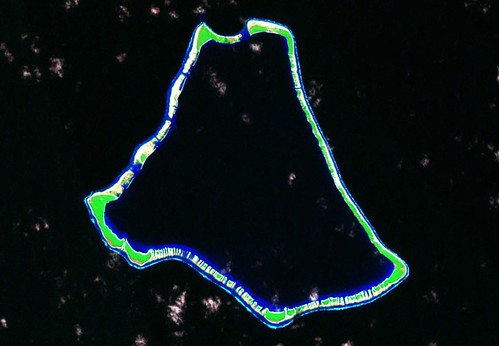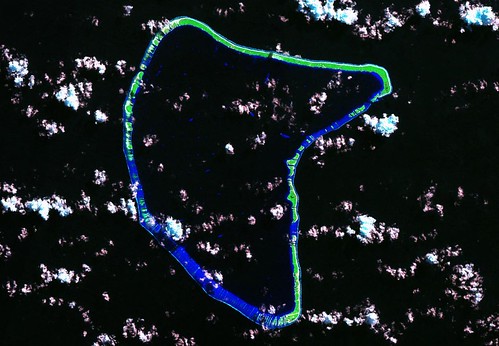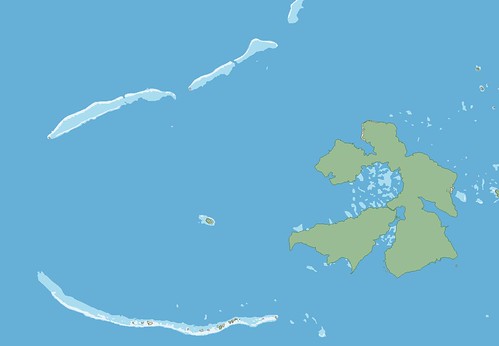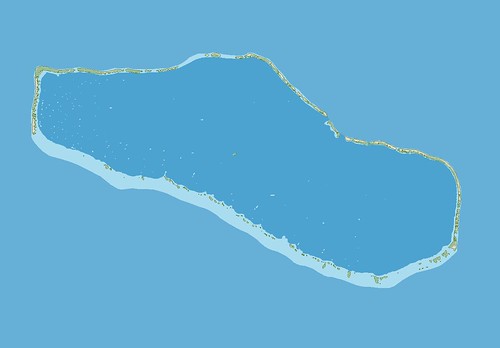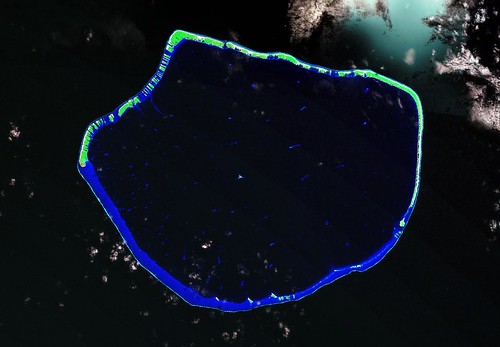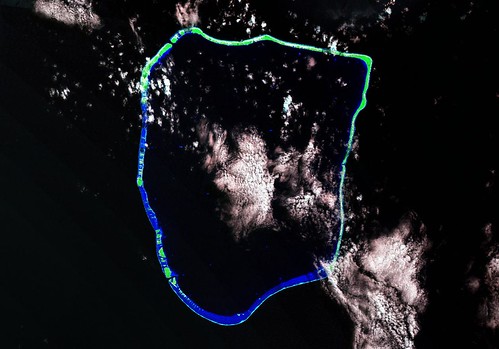
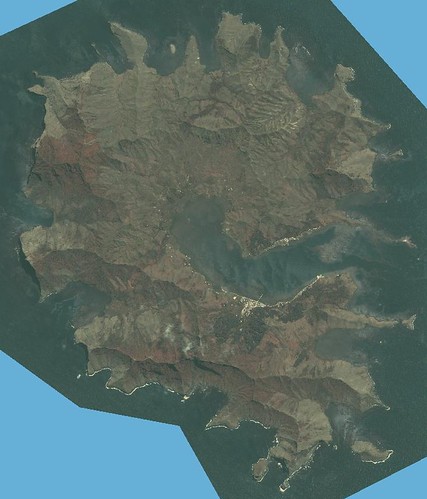
Apataki Atoll FP - Landsat ETM+ S-06-15_2000 (1:225,000)
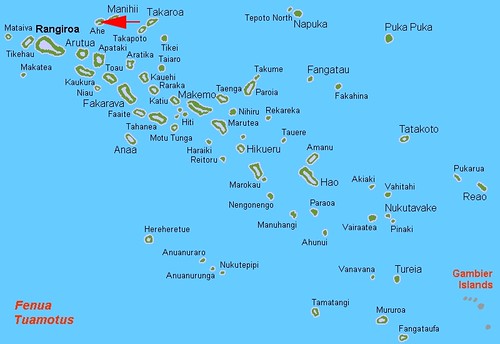
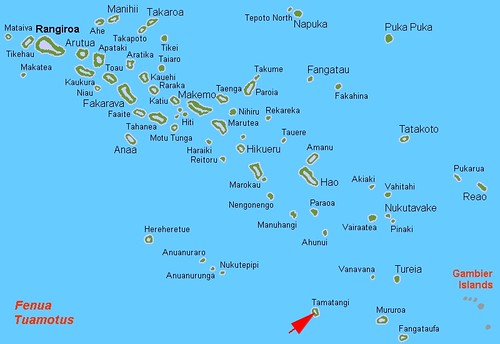
There are ten islands within the Palliser Islands. With the completion of Apataki Atoll, I have mapped nine of the ten. Still to do is Rangiroa Atoll, the largest in the Tuamotus and one of the largest in the world. It will have to wait for another day.
Apataki Atoll is 27-km wide by 36-km long and approximately 105-km in circumference. It has a population of 430, with the majority living in the village of Niutahi. The lagoon has at least two entrances permitting larger sailing vessels passage into and out of the lagoon. There is an airfield located adjacent to the village. The island does have accomodations for visitors.
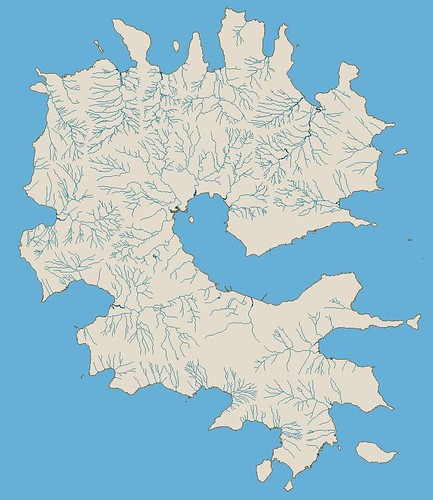
With all that said, lets get to the real joy - the EVS precision map of the atoll!
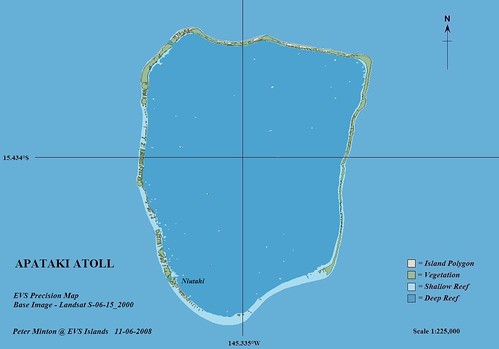
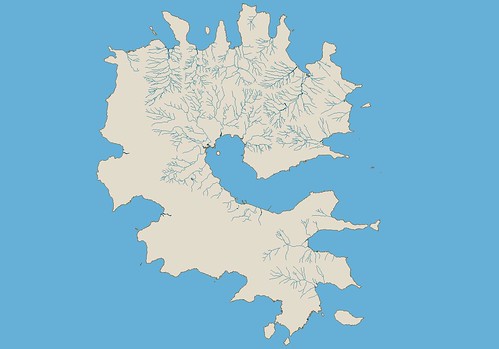
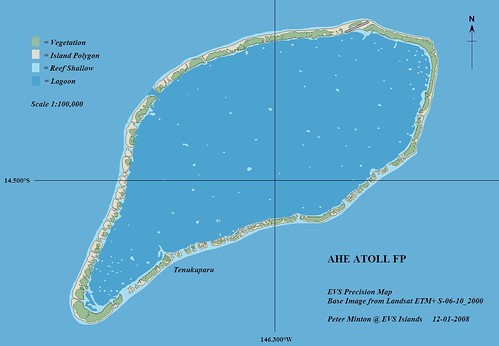
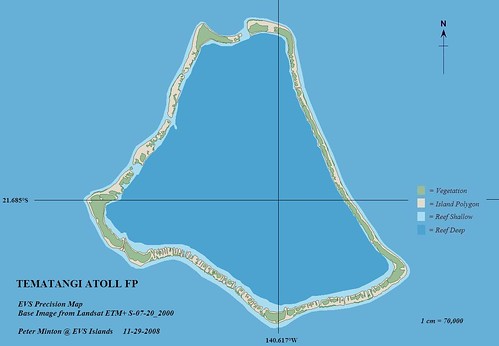
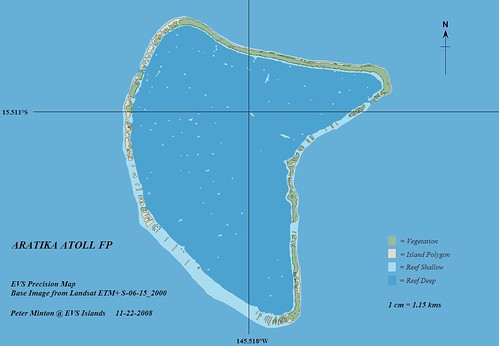
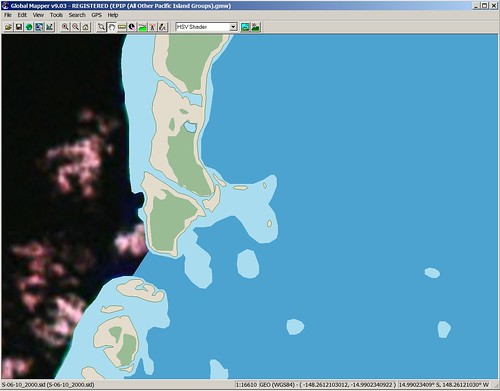
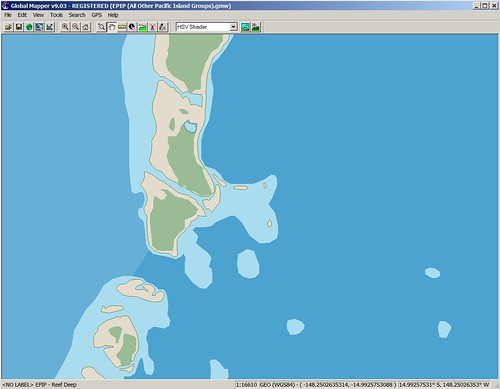
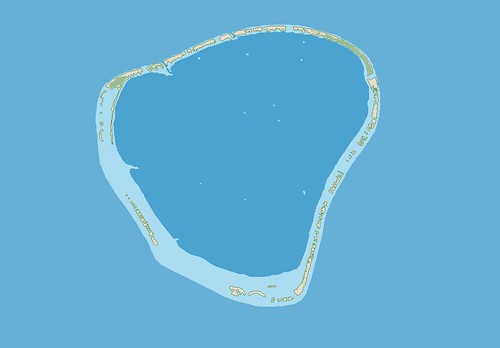
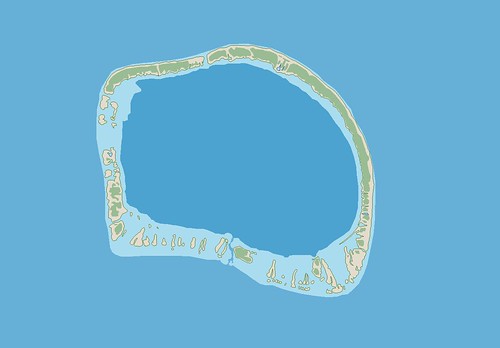
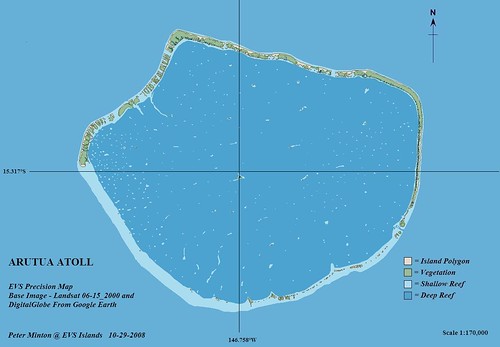
Apataki Atoll FP - EVS Precision Map from Landsat S-06-15_2000 and DigitalGlobe (1:225,000)
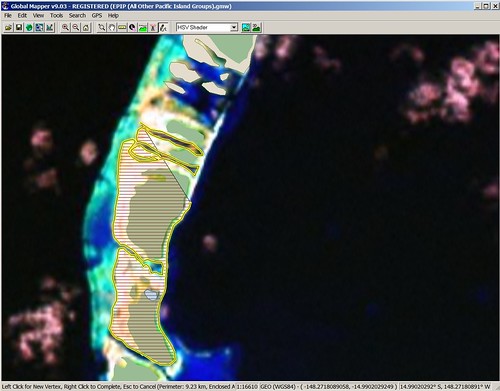
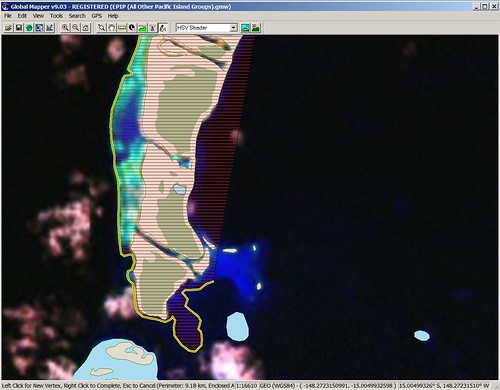
Using two base image sources, Landsat ETM+ and DigitalGlobe, this project took approximately six hours to complete. The map consists of 192 island polygons. If Landsat shows a vegetation color signature, I map it as a portion of the vegetation layer. The other two layers consist of a shallow reef and a deep reef. Once the EVS precision mapping was completed, I finished my work using ImageForge, which allows me to add lat/lon, legend, north arrow and credits.
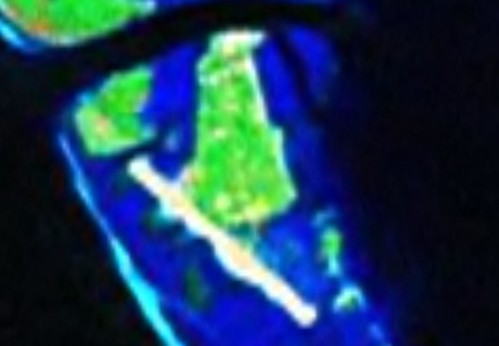
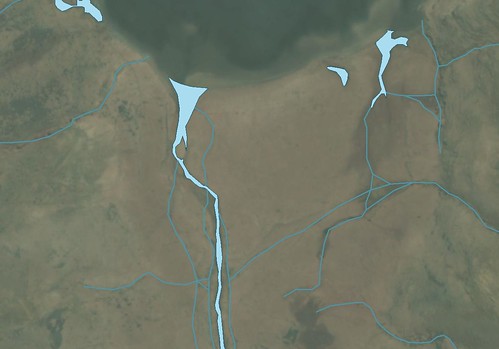
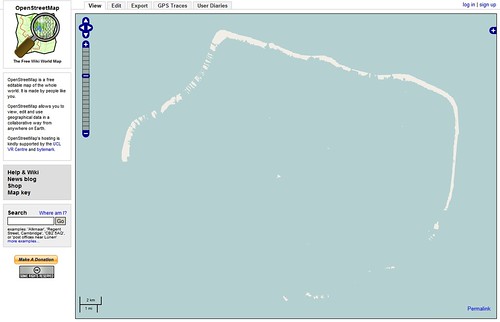
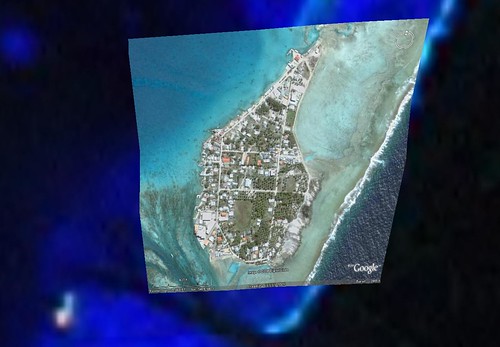
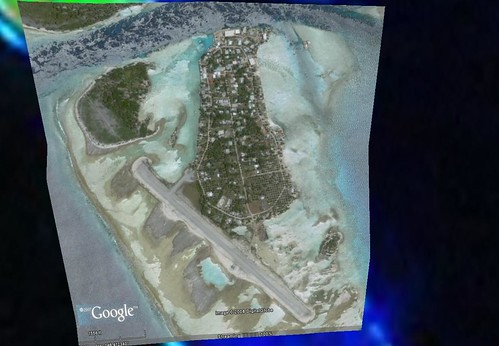
Apataki Atoll FP -Niutahi Village - Landsat ETM+ S-06-15_2000 (1:7,500)
This is an extreme closeup of Niutahi village. I do have an EVS precision map of this portion of the atoll, but I decided to work with a DigitalGlobe overlay to provide additional details to the village area.
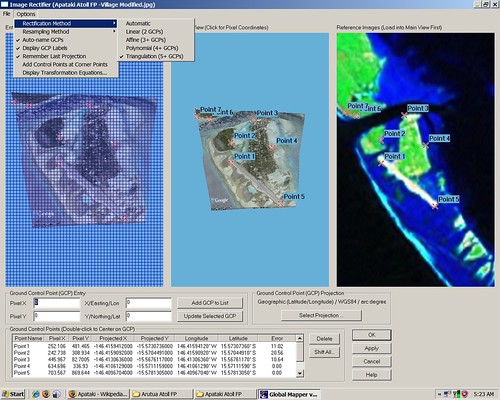
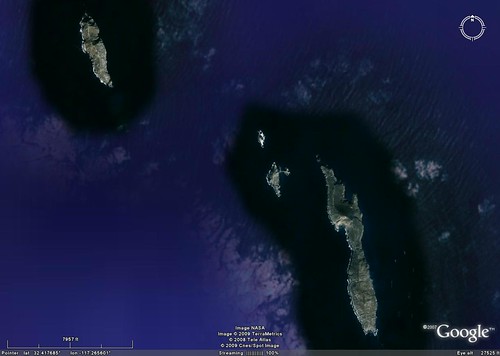
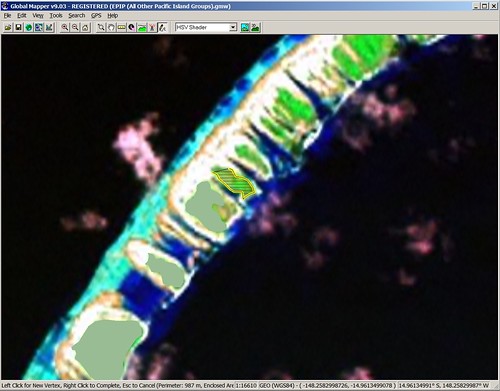
Apataki Atoll FP - Niutahi Village - Georectifying DigitalGlobe Image using Global Mapper
Finding the atoll in Google Earth and determining that DigitalGlobe imagery exists for the atoll, I zoomed in and saved an image of the village proper. In order to georectify the image to create an overlay that would align with my Landsat base image, I had to import the DigitalGlobe image into my mapping software, Global Mapper. Using GM's georectifying tool, I determined that the triangulation method using seven GCPs would create the best alignment.
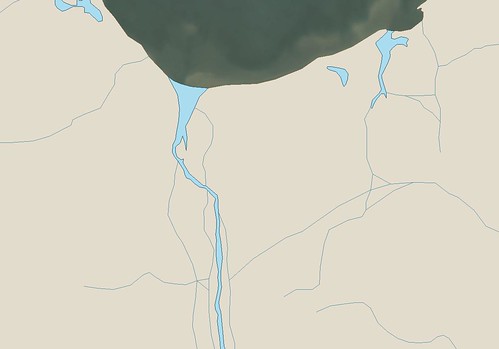
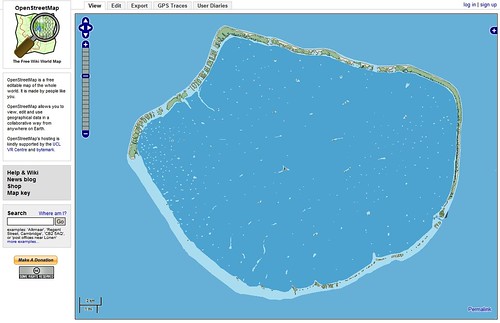
Apataki Atoll FP -Niutahi Village - Georectified DigitalGlobe Image from Google Earth (1:7,500)
Once georectified, the DigitalGlobe image aligned quite well over my base Landsat image. Using the triangulation georectifying method, which requires a minimum of 5+ GCPs, allowed for image distortion, which was necessary. This method allowed the DigitalGlobe image to be stretched and tugged into place.
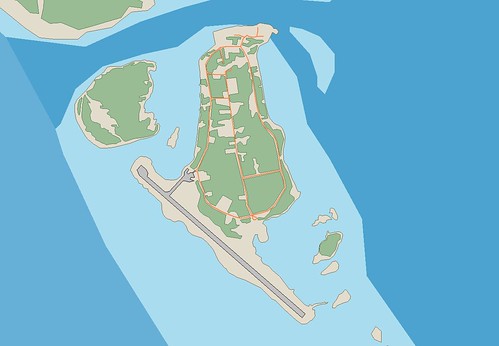
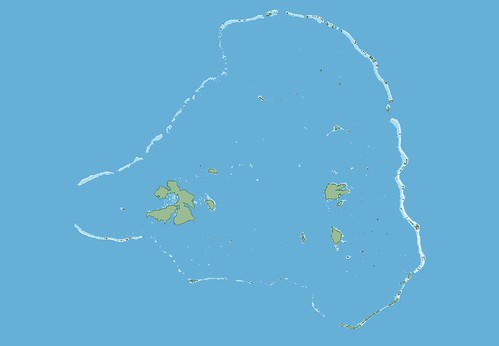
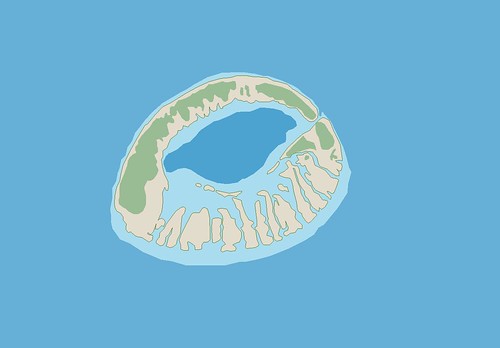
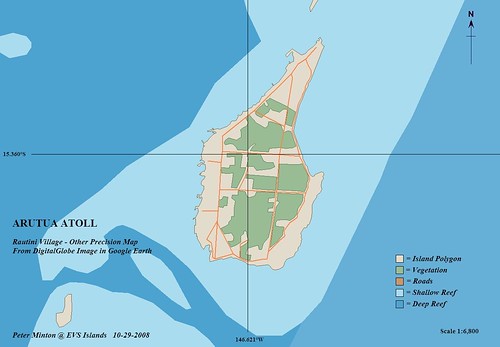
Apataki Atoll FP -Niutahi Village - EVS Precision Map from DigitalGlobe Image from Google Earth (1:7,500)
I was able to map Niutahi village at 1:7,500 scale. I could have pushed to a finer scale, but for my purposes, this scale worked just fine. I did add a road layer (orange lines) and an airfield layer (grey polygon).
In the center of the lagoon the Landsat image has cloud issues. I was not able to map any of the central lagoon coral heads which I identify as shallow reef, otherwise this EVS precision island map is done.
Enjoy!
 >
>