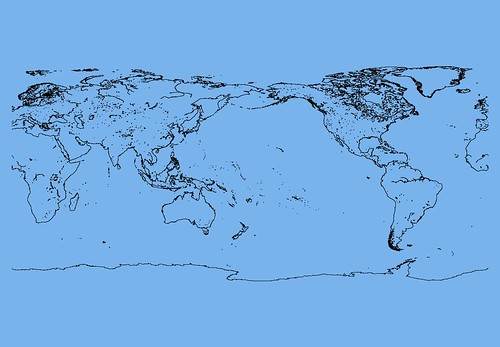
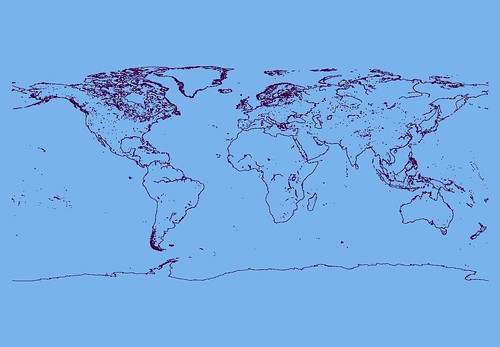
WVS/GSHHS - Pacific Centered
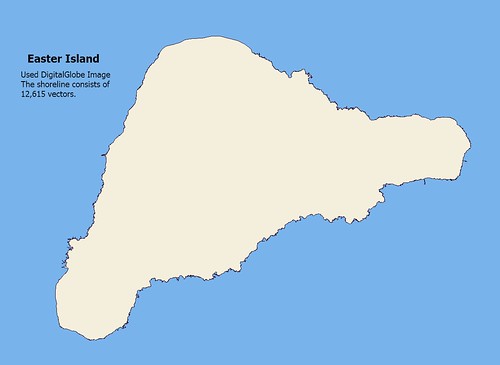
Over three years ago I learned of the GSHHS vector map file of the world shorelines. The data is reworked WVS, which allows one to construct a 1:250,000 world map. My problem was the only mapping software I used at the time was Marplot. Unfortunately, Marplot is quite limited in files that can be imported into it. So I held this data until I purchased software that could read and display the data. Along came Global Mapper.
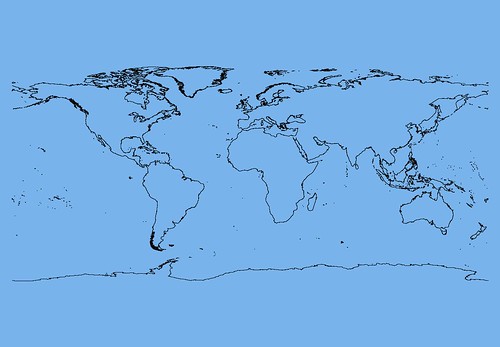
WVS/GSHHS - Atlantic Centered
WVS/GSHHS - Atlantic Centered without Inland Water Features
I did not want to work with a Pacific-centered map. The version of the GSHHS only came as a Pacific-centered map. I prefer working with Atlantic-centered map. So I asked Mike, at Global Mapper, if he could modify the file into an Atlantic-centered map file. He said sure, and he did it that same day. This map I could use. I loaded the files into Marplot and used them extensively as a primary global shoreline. But somebody stuffed a batch of water features into this database. So, for the past 4-hours I carefully removed, named and relayered these inland water features.
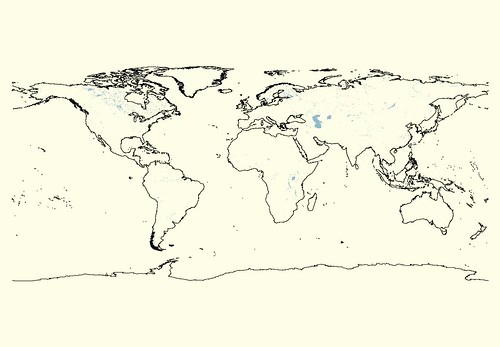
GSHHS - Atlantic Centered with Inland Water Features Modified
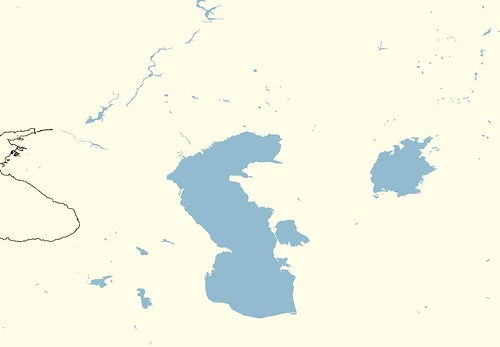
WVS/GSHHS - Atlantic Centered with Inland Water Features; Detail Caspian Sea
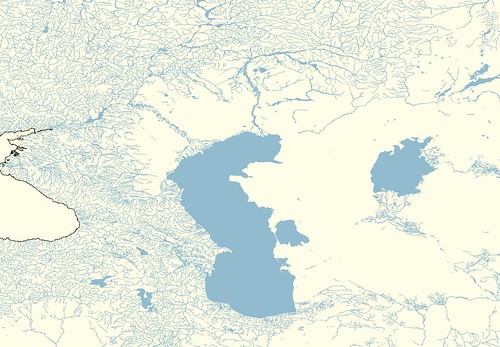
WVS/GSHHS - Atlantic Centered with Inland Water Features and Streams; Detail Caspian Sea
After removing these inland water features from the WVS/GSHHS data set, I converted them into polygons and placed them back into the WVS/GSHHS map. I then inserted the VMap0 stream/river/intermittent stream line file which I had extracted from VMap earlier. The final map above shows the Caspian Sea with all of the streams that feed into it.
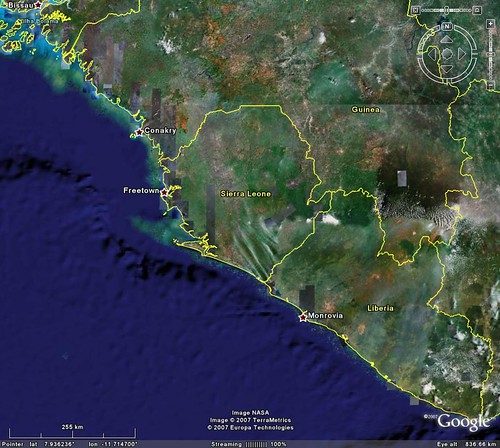
What prompted me to go through this exercise, was the four or five readers every day that come to this website looking for world shorelines. The WVS/GSHHS data is excellent. It allows one to plot a highly accurate view of the world. Using the NGDC Coastline Extractor one can download various layers of boundary information, along with the global shorelines.
It turns out that the GSHHS data is now available as an Atlantic-centered map with all of the inland water features bundled with the primary shoreline data as additional layers of information. And the price is FREE!
I really like the WVS/GSHHS data. Once loaded, it gives one an excellent shoreline resource. What you need after loading the WVS/GSHHS data is the VMap0 data layers (Roads, Railroads, Contours, Depth Contours, streams, lakes, etc.). Then you have a very slick map to work with.
Enjoy!