Sunday, June 27, 2010

How To Digitize Vegetation and Land Layers using Landsat Imagery at 1:12,500 Scale

Faaite Atoll FP - Comparison - Landsat Image, EVS Precision Map, DigitalGlobe Image (1-12,500)

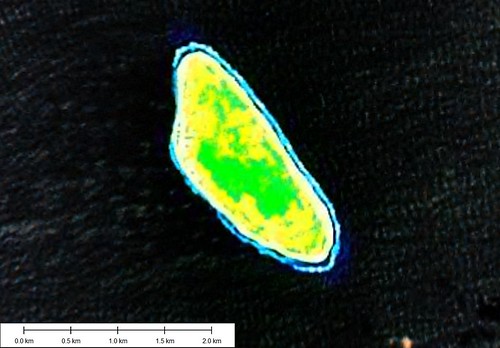
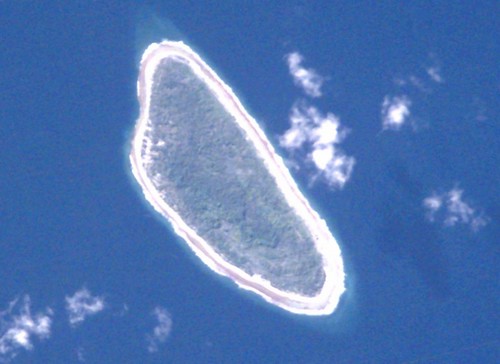
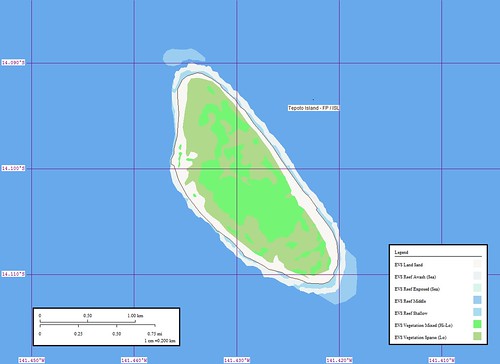
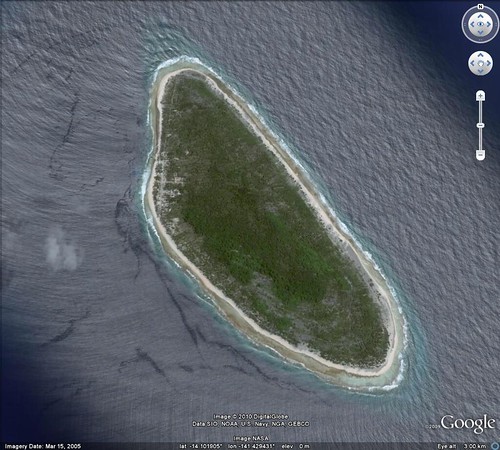
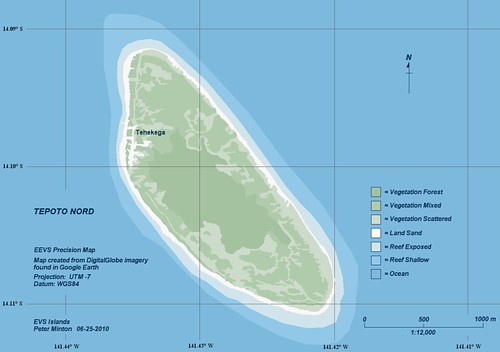
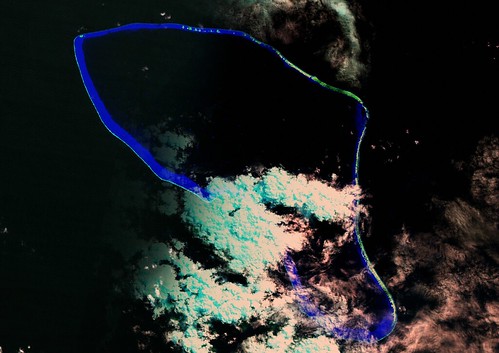
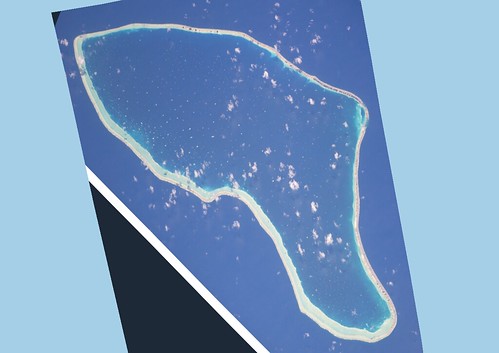
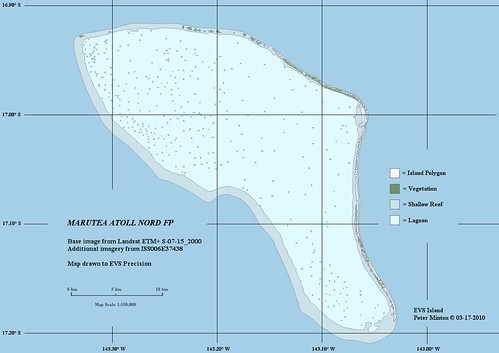
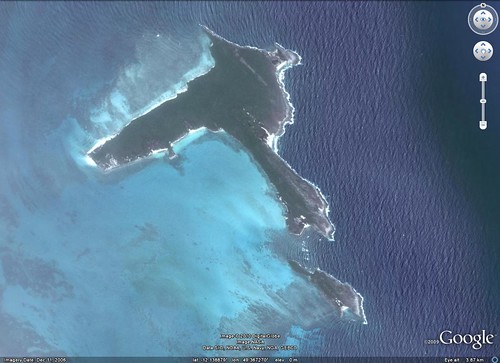
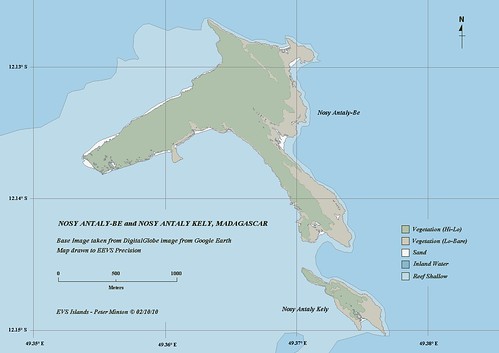
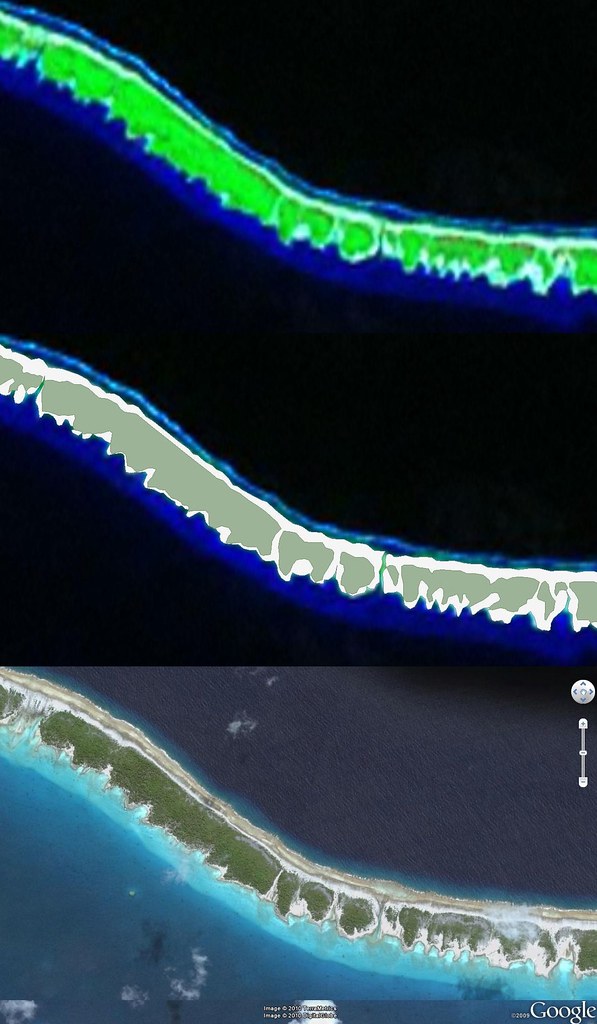
Faaite Atoll FP - Comparison - Landsat Image, EVS Precision Map, DigitalGlobe Image (1:12,500)

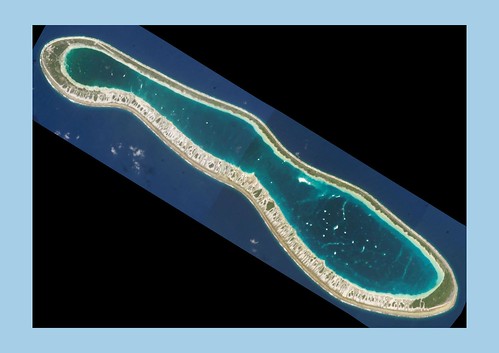
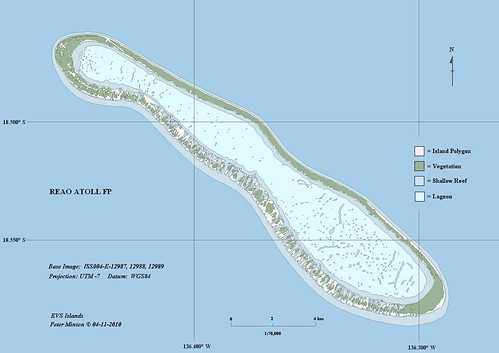
I keep telling all of you that I typically digitize off of Landsat imagery at approximately 1:12,500 scale. Checking out the above montage you will see a Landsat image of a portion of Faaite Atoll FP. Beneath it are two layers of information I digitized using Landsat as base imagery, vegetation and land. The final DigitalGlobe image from Google Earth is of the same stretch of atoll. The Landsat image has a green hue over all of the land and vegetation features. However, having digitized so many islands the sand or low vegetation, which I classify as land is identifiable. My Landsat derived vegetation layer is a decent approximation based on the vegetation shown on both Landsat and DigitalGlobe's hires imagery. The digitized land layer, I believe, is a strong match.

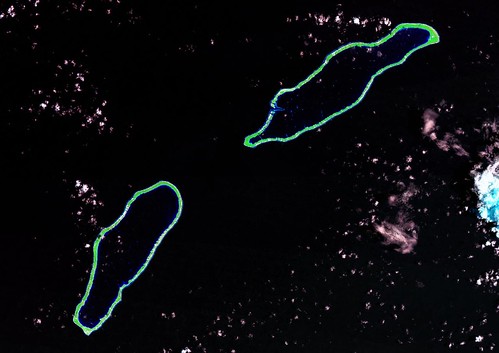
Why should one care at what scale one is able to digitize using Landsat as base imagery? Ask any photogrammetrist and they will tell you Landsat is reliable between 1:125,000 to 1:62,500. Each pixel covers a ground area of 14.5 meters by 14.5 meters. However, working at 1:12,500 does not render an image useless, but allows one to discern details in a rough but usable fashion. I can't make out individual trees, but I can identify stands of vegetation and most often the density of that vegetation. The most difficult feature on an atoll to reliably digitize is that portion of the reef which is awash depending on the time of day (high tide or low tide) and the amount of vegetation found growing on the reef. It is often difficult to determine whether the feature is above water land or below water shallow reef. Typically, if I'm uncertain I classify the feature as above water land.

Who knows, one day you might want to try your hand at island map making and you will want advise as to what scale you might expect to work at using Landsat as your base imagery. Digitizing at 1:12,500 should work just fine. Give it a try.

Saturday, June 26, 2010

Tepoto Nord FP - A Redo of a Redo of a Small Coral Island

Tepoto Island FP - Image

Tepoto Nord FP - Landsat Image from S-07-10_2000 (1:20,000)


Tepoto Island FP - ISS002-E-8862

Tepoto Nord FP - ISS002-E-8862 Image


Tepoto Island FP - Map

Tepoto Nord FP - EVS Precision Map (1:20,000)

My first map of Tepoto Nord was completed on March 31, 2006. I used Landsat as my base imagery. Most of my finish work was done using Marplot, a fine poor-man's GIS program. In December 2006 , I came upon the ISS image of Tepoto Nord. I decided to redo my original work using the ISS imagery to digitize from.

I look at my completed Tepoto Nord mapping project today and contemplate how far my map making skills have progressed. My digitizing of shorelines, vegetation and reefs remains fairly consistent. I routinely work at between 1:12,000 to 1:8,000, depending on my base imagery and the ultimate objective for my map. I am content to map four to five layers of information taking what Landsat is able to provide. The first time I mapped this island, I remember being frustrated by the Landsat imagery. The odd colors and blurred appearance of the island made digitizing problematic. Eventually, I came upon the ISS image and was able to redo my mapping of this small island in a more satisfactory manner. I reposted the map and base imagery in December 2006 and gave this small island no more thought.

That is until I received a question from an EVS Islands reader. He wanted to know everything he could about this small island. I answered that he should contact Alex W du Prel, publisher of Tahiti-Pacifique magazine. If anyone could give information about this small island, Alex is the man. After answering the reader's question, I checked out my map of the island. Unsatisfactory! The map presentation choices I make today are far superior to those I made in 2006. I decided to redo my redo of this small coral island.


Tepoto Island Nord FP - DigitalGlobe Image from Google Earth (1-12,000)

Tepoto Nord FP - DigitalGlobe Image from Google Earth (1:12,000)


Tepoto Island Nord FP - EEVS Precision Map (1-12,000)

Tepoto Nord FP - EEVS Precision Map (1:12,000)

I checked out Google Earth, as almost all of the islands within the Tuamotus are covered by DigitalGlobe's hires imagery. Sure enough, Tepoto Nord has excellent, cloud-free imagery from which I could redigitize various layers of information with a high degree of confidence. Seven layers of information later my redo of the redo is done. Since I have no designs to offer the map for commercial purposes, I decided to use DigitalGlobe imagery as my base imagery. I have worked on this redo of a redo for about two weeks. Not because it was particularly difficult, but I've been busy with school. Finally, I have a Saturday with no pressing projects. Only this, to finish my Tepoto Nord FP map. Pretty nice, huh?

Enjoy!

Monday, April 12, 2010

Reao Atoll FP - Finished . . . At Last!

Reao Atoll - Island Locator

Reao Atoll


Reao Atoll - ISS004 Image Mosaic (1-70,000)

Reao Atoll - ISS004 Image Mosaic (1:70,000)


Reao Atoll - EVS Precision Map (1-70,000)

Reao Atoll - EEVS Precision Map (1:70,000)

Reao or Natūpe is an atoll in the eastern expanses of the Tuamotu group in French Polynesia. The closest land is Pukarua Atoll, located 48 km to the WNW.

Reao is 24.5 km long and its maximum width is 5 km. The whole length of its north-eastern rim is occupied by a single long island. There is no navigable pass into the lagoon.

Reao Atoll's population is 344 inhabitants.

That is about it for Reao Atoll on the internet. There might be some scattered bits of information, but nothing of newsworthy significance. Why? It could be the location. Unlike many of the other atolls making up the Tuamotus that receive numerous pleasure cruisers, Reao Atoll is situated away from the normal cruising routes. In addition the lagoon has no entrance for sailing vessels making for percarious landings on and off of the main island.

Even with the geographical difficulties associated with Reao Atoll, I wouldn't mind visiting. The southern end of the atoll looks a bit on the wild side. If not real wild, it looks to be far from the population center of the island located on it's northern end. One could perhaps find an isolated small motu along the atoll's western edge. There are in the neighborhood of 50 motus along this edge of the atoll. I am certain one of these small motus could offer one a few days of solitude. If not a few days, for sure a few hours.

Now for a few comments on the map. First, the base imagery is from ISS004. I took 3 excellent images and assembled them into a mosaic of the entire island. I rotated the image about 37° to align it with the atoll's true alignment. I had created a shoreline of Reao Atoll a few years back, but had not saved the georectified image. All I had to work with was the island polygons which came from the ISS004 imagery. I used over 37 GCPs (ground control points) to georectify the ISS004 image mosaic. It wasn't until this weekend that I had both time and energy to complete my typical four vector layers - island polygons, vegetation polygons, shallow reef polygon and lagoon polygon. I completed all of the layers as Phil Mickelson was busy winning the Masters for the 3rd time.

P.S. - Later that day, I compiled my first OSM formatted vector file consisting of the island polygons. Ultimately my goal is to place my EVS copyright free vectors onto OpenStreetMap. That is another story for later time.

Wednesday, March 17, 2010

Marutea Atoll Nord FP - An Uninhabited Atoll...Kind Of

King George Islands FP - Locator Map Wagner IV World

Marutea Atoll Nord FP


Marutea Atoll Nord FP - Landsat ETM S-07-15_2000  Image (1-150,000)

Marutea Atoll Nord FP - Landsat ETM S-07-15_2000 Image (1:150,000)

A portion of the Landsat ETM+ image looks great, the other portion is cloud covered. If I had only used the Landsat image to create my EVS precision map, it would have been an incomplete effort. Fortunately, ISS imagery helped to fill in the gap.


Marutea Atoll Nord FP - ISS006E37438 Modified Image (1-150,000)

Marutea Atoll Nord FP - ISS006E37438 Image Modified (1:150,000)

First I had to rotate the ISS image and georectify it to my Landsat base image. I was able to do it after much tweaking of the ISS image it was positioned properly for my mapping purposes. Many of the coral heads, which I classify as shallow reef, were derived from the ISS image.

Marutea Atoll Nord FP - EVs Precision Map (1-150,000)

Marutea Atoll Nord FP - EVs Precision Map (1-150,000)

And here is the finished map! If one requires hi-res imagery, it can be found in Google Earth. Located at the channel leading into the lagoon are a few houses. I suspect they are used by coconut or black pearl harvesters. Although the island is uninhabited, people frequent the atoll doing the things that people do, harvesting resources.

Looking at the DigitalGlobe imagery found in Google Earth, large stretches of the island appear to be without a sand covering. It looks as if the island was washed over by a typhoon or a storm surge. Perhaps someone with first hand knowledge might share more about this uninhabited atoll...kind of.

Enjoy!

Sunday, February 28, 2010

Thoughts - Which Color Scheme Works Best for EVS Maps?

King George Islands FP - Locator Map Wagner IV World

King George Islands FP


King George Islands FP - Landsat ETM Image S-06-10 (1-175,000)

King George Islands FP - Landsat ETM S-06-10_2000 Image (1:175,000)


King George Islands FP - EVS Precision Map (1-175000)

King George Islands FP - EVS Precision Map (1:175000)


Takapoto Atoll FP - EVS Precision Map (1-80,000)

Takapoto Atoll FP - EVS Precision Map (1:80,000)

I spent today digitizing the King George Islands located in the Tuamotu Islands FP. The top atoll, Takapoto, was just completed using my new NIMA color scheme. Not only am I limiting layers to EVS island projects to island polygon, reef shallow, lagoon and island water feature, but I've changed my color scheme to match NIMA's nautical charts. My current color scheme is as follows:

island polygon is R-245 G-245 B245

reef shallow polygon is R-205 G-225 B-235

lagoon is R-225 G-250 B-255.


Takaroa Atoll FP - EVS Precision Map (1-80,000)

Takaroa Atoll FP - EVS Precision Map (1:80,000)

Takaroa Atoll, completed a few months ago, contains my old color scheme:

island polygon is R-240 G-232 B-217

reef awash is R-208 G-234 B-224

reef shallow is R-153 G-214 B-236

lagoon is R-090 G-169 B-211

In both projects the vegetation layer R-157 G-179 B-151 and the deep ocean layer R-165 G-207 B-231 are unchanged.

For visual appeal, I like the old style. The NIMA nautical chart style gives a cleaner, crisper look. What do you think?

Enjoy!

Tuesday, February 16, 2010

Nosy Antaly-Be, MA - Fishermen, Tourists and WWII Japanese Midget Submarines

Nosy Antaly-Be MA - Locator Map

Nosy Antaly-Be, MA,


Nosy Antaly-Be MA - DigitalGlobe Image from Google Earth (1-12500)

Nosy Antaly-Be, MA - DigitalGlobe Image from Google Earth (1:12,500)


Nosy Antaly Be MA - EEVS Precision Map (1-12500)

Nosy Antaly-Be, MA - EEVS Precision Map (1:12,500)

Every so often I like to scout a coastline in Google Earth to find an interesting island to map. Nosy Antaly-Be's image is cloud-free, hi-resolution and located along the eastern shore of the northern peninsula of Madagascar. The two islands I mapped are the northern most of a cluster of islands that are just off shore as one enters Diego-Suarez Bay. I mapped these two islands because I was bored with my current project, remapping Papua New Guinea, a very big job. I wanted to make a pretty map and to use DigitalGlobe imagery. So far, so good!

I mapped the islands quickly and completed all of the additional details using Global Mapper. My cursory check for information concerning these two islands initially turned up nothing of great interest. The semi-permanent population was made up of fishermen and tourists. Then came the WWII Japanese midget submarines. In 1942 Japan flush with a number of victories in Southeast Asia looked to control the entire Indian Ocean. A key area to control was the northern end of Madagascar. From this vantage point they would have been able to intercept allied shipping with ease. They attacked ships located in Diego-Suarez Bay in May, 1942. One ship was damaged and another was sunk with a lose of 6 crewmen. If you would like to know more about the "Whys" and "What Fors" follow this link, Imperial Submarines. The article will give you loads of background information concerning Japanese midget submarines and the war in Madagascar.

Life never fails to intrigue me. I select two nondescript islands and they turn out to be used to screen Japanese ships prior to an attack on ships in Diego-Suarez Bay. Who would have thunk it.

Enjoy!

Monday, February 15, 2010

Caspian Sea Isobaths from Russian Topographic Maps

Caspian Sea Contours - Map

Caspian Sea Isobaths - Taken from 1:1,000,000 Mapping


Caspian Sea Isobaths - Entire Sea (1-5,000,000)

Caspian Sea Isobaths - Entire Sea (1:5,000,000)

If I'm not careful, I can turn a finite mapping project into a never ending task, one that requires tweaks on top of tweaks. My Caspian Sea isobaths fall into that type of project. I have worked on the Caspian Sea shoreline and now isobaths since 2006 and I'm still not finished. The northern shore, including the Volga River delta remain my final shoreline to map. At my current rate I should be finished around 2012. In the mean time I would like to share my recently completed Caspian Sea isobaths. These isobaths were taken from Russian topographic maps downloaded from Poehali.org. One can download Russian topographic maps for free. The maps are georeferenced and load easily into most mapping programs. My Caspian Sea topographic map is a mosaic of 65 individual maps at scales between 1:500,000 to 1:100,000. All of these maps contain isobaths. Using the most detailed scale, I constructed the following isobaths: -10m, -20m, -50m, -100m, -150m, -200m, -300m, -400m, -500m, and -700m. Compared to the other Caspian Sea isobaths, mine differ. I hesitate to claim my isobaths are more accurate. I suspect they are, as they were derived from 1:500,000 to 1:100,000 scale maps. The other isobaths were taken from 1:1,000,000 scale maps.


Caspian Sea Isobaths - Baku Vicinity (1-250,000)

Caspian Sea Isobaths - Baku Vicinity (1:250,000)

Where my isobaths prove most interesting is when one zooms into an area. An interesting area to study these isobaths is around Baku, the site of many oil rigs. The isobaths twist and turn in and around oil rigs as one would expect.


Caspian Sea Isobaths - Baku Vicinity Offshore (1-62,500)

Caspian Sea Isobaths - Baku Vicinity Offshore (1:62,500))

Currently, my Caspian Sea isobaths are quietly residing on my hard drive. Before I do anything with them, other than my own mapping, I need to secure permission from Poehali.org. I know I did an excellent job tracing these unique isobaths. Not sure this is going to be a "give away". Would love to make a buck or two off of this data set. We'll see.

Enjoy!