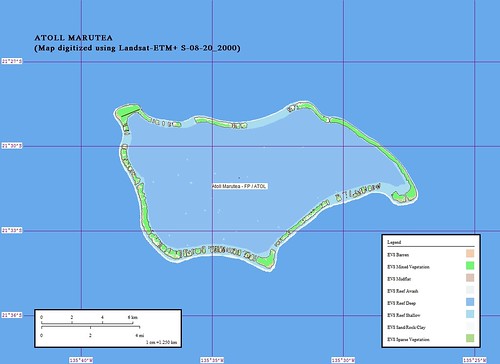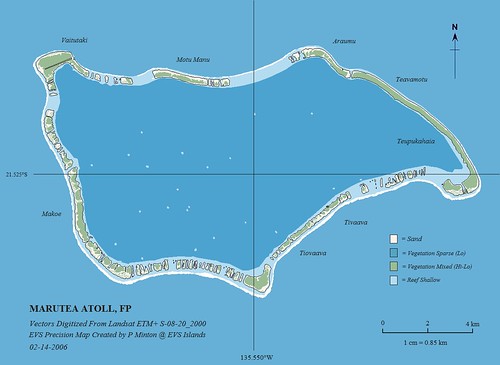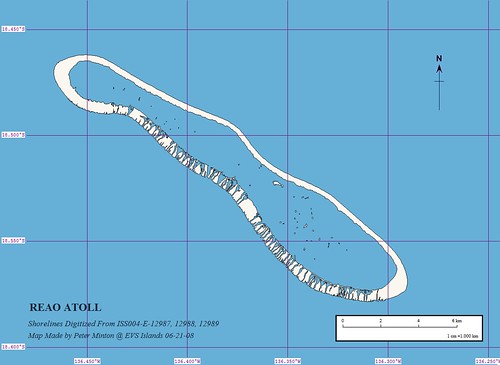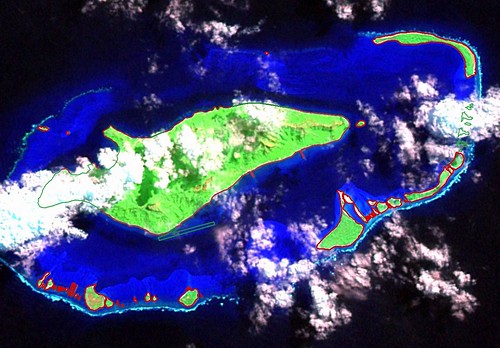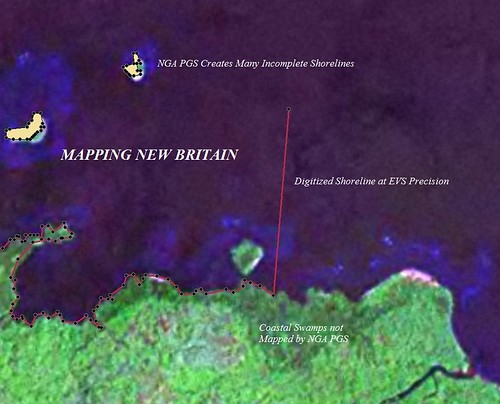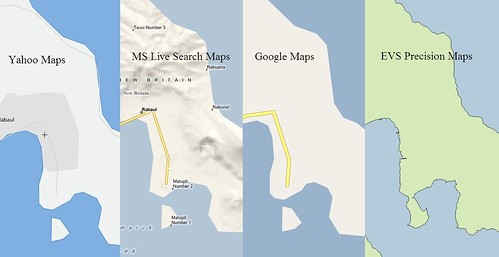
Shoreline Map Comparison - Yahoo, Google, MS and EVS Precison
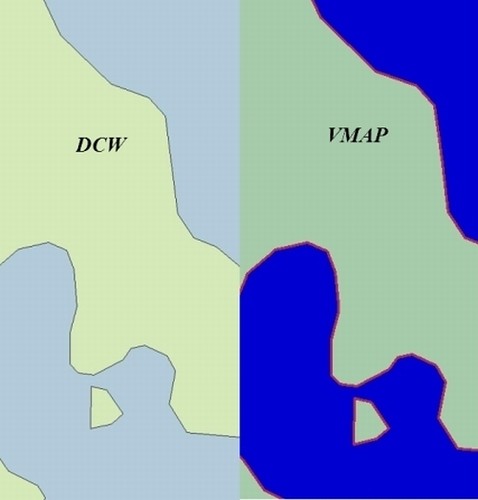
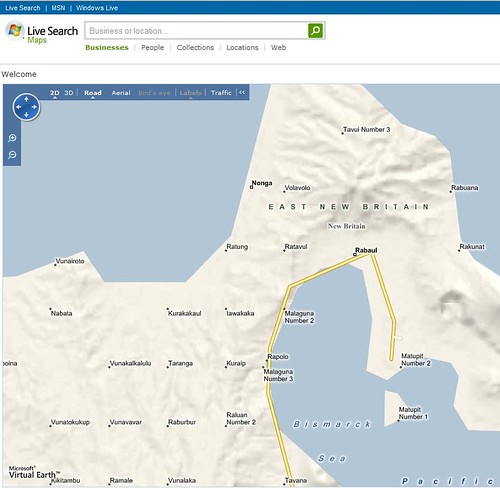
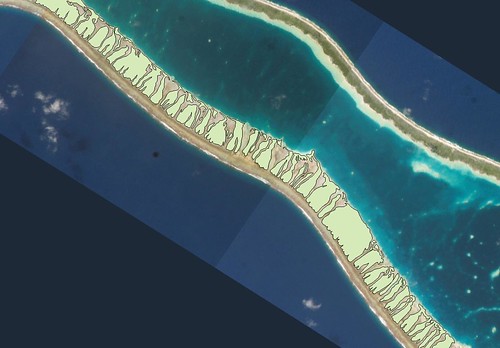
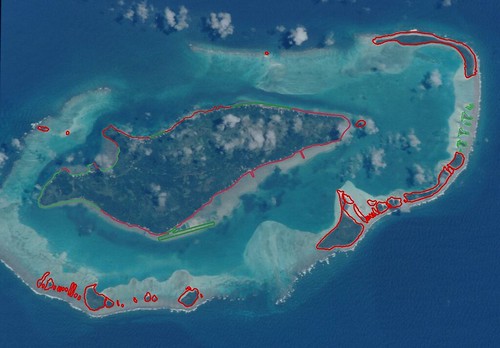
Shoreline Map Comparison - DCW and VMAP0
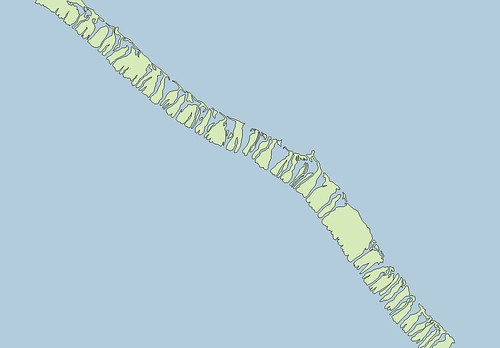
This post shows that Google Maps, Yahoo Maps and MS Live Search Maps use DCW/VMAP0 global shorelines for their mapping, at least in the area of Rabul. That is 1:1,000,000 scale global map coverage. James Fee, a well-respected GIS professional, commented, "When it comes to precision, I think the efforts for GYM (Google, Yahoo, Microsoft) should be on the navigation/geocoding/routing and not shorelines." First, one must agree with James' statement that GYM's maps are intended primarily for navigation/geocoding/routing. I believe that their customers, global in reach, would subject GYM's maps to many other GIS uses beyond navigation/geocoding/routing. I know that there is an agressive effort within the GIS community to provide a richer, more powerful set of tools, allowing any of us the opportunity to explore more complex spatial issues using Google Maps and Google Earth as platforms of choice. Ultimately, the end user, faced with a spatial problem requiring small scale maps would either have to make their own map, pay to have a map made, use a substandard map in place or not use a map at all.
In addition, James seems to suggest that 1:1,000,000 scale is satisfactory for GYMs primary efforts of navigation/geocoding/routing. I understand his reasoning, but I disagree. Before teaching, I did extensive geocoding of environmental risks. Locational precision was critically important. 1:1,000,000 was an unworkable geocoding scale. To follow the flight path of an enemy aircraft using 1:1,000,000 is doable. However, to locate enironmental risks at that large of a scale is asking for problems. A misplotted environmental risk could well result in a lawsuit. Business locations was another area I worked in and locational precision determined an exclusive market and was a contractual promise to the franchisee.
James goes on to say, "For me the shorelines are somewhat irrelevant to the routing provided. If I do need good shorelines, I'll probably just be using the aerial imagery in the first place." Again, his reasoning seems to make sense, but I disagree. First, shorelines are not somewhat irrelevant, they are a dynamic boundary between man and water. A raster image of a shoreline is practical for some applications, but a vector defined shoreline offer one a wide range of mapping possibilities. If I am GYM's map guru, I want my customers to have the greatest mapping precision possible. I don't want to impose precision limitations when there is no need. EVS precision shorelines, on a global scale, requires money to fund the mapping effort and time to complete the project. It will be money well spent. The resulting shorelines and other feature/land use layers will allow the "G", the "Y" or the "M" to be the number one mapping destination for all users and that could generate lots of ad dollars.
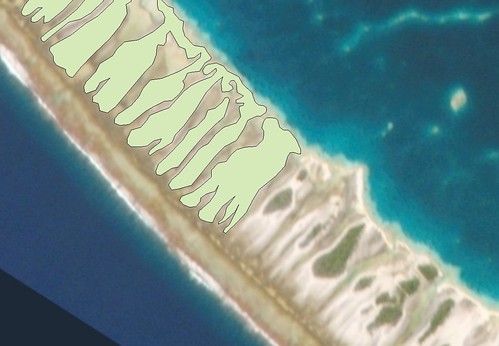
Finally, vector maps allow for infinite zooming with no lose of detail. If the initial vectors are created from quality base imagery (i.e., Landsat ETM+) and the map customers are able to easily access these detailed vector maps, they can tackle complex spatial issues using GYM's hi-precision mapping. Thus a marketing boon to the company savy enough to provide the product.
Enjoy!
P.S. - After yesterday's post, I received a query from an individual about EVS precision mapping for a section of Canadian shoreline. He had used WVS/GHHS vectors and they were unsatisfactory for his project. I sent him NGA PGS vectors covering his target area. They looked okay at 1:250,000 scale. He loaded them and acknowledged they were a significant improvement over the WVS/GHHS vectors, but were angular and did not track a cloud-free shoreline as one would expect. I created EVS precision vectors for him. He compared them to NGA PGS vectors and immediately acknowledged their higher quality. He asked if I would go ahead and create EVS precision vectors for his entire study area. I will, but wouldn't it have been cool for him to go to one of the big three mapping portals and find this mapping not only available, but downloadable? I think so.