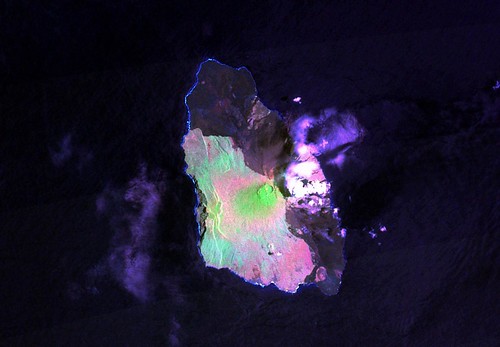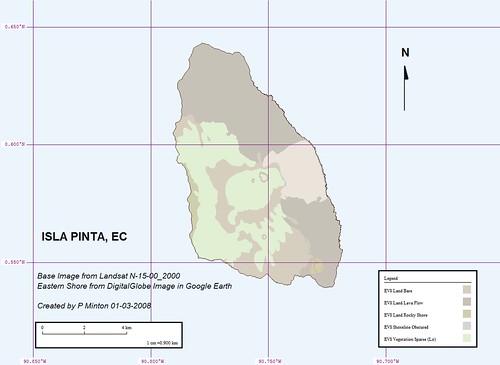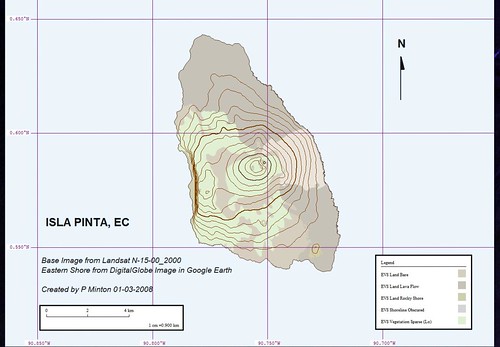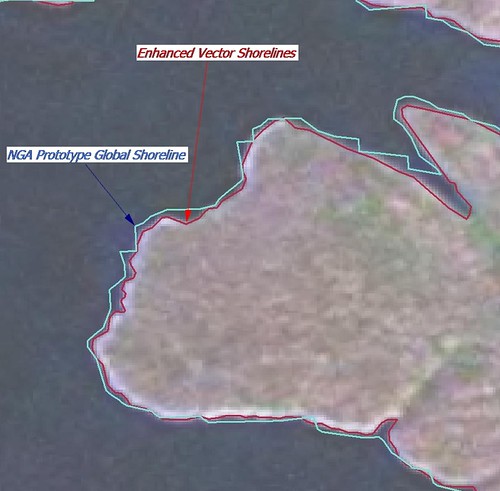
Kyra Panagia - EVS Compared to NGA PGS
Comment posted by Anonymous:
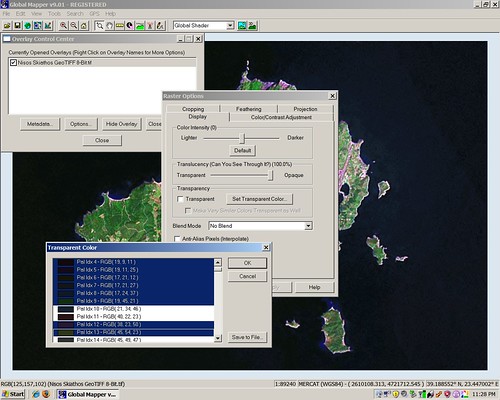
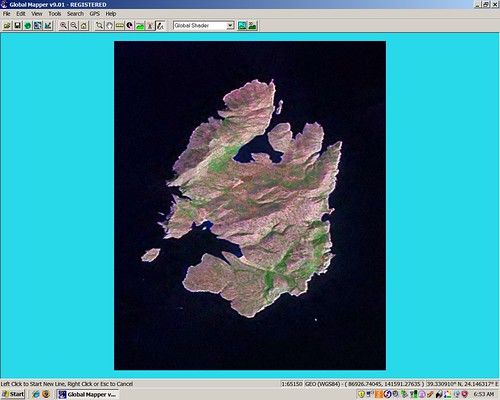
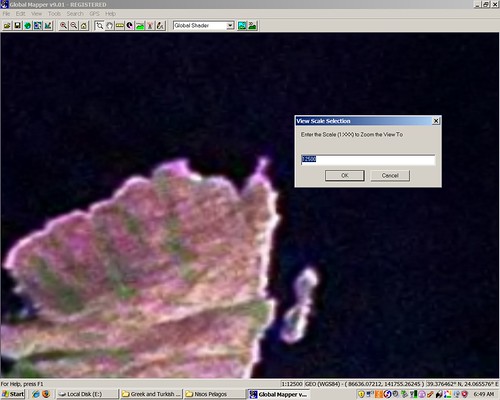
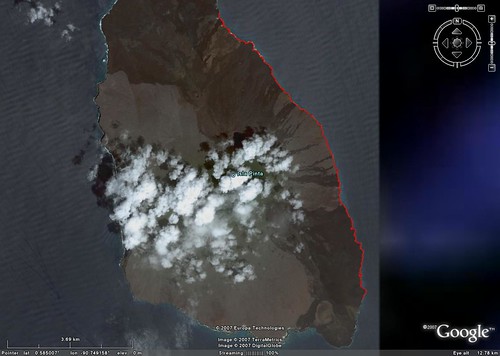
Shorelines are usually created through stereoplotting or derived from surface models - rarely from monoplotting like you do. The problem with monoplotting is that your shorelines will be different depending on the tide, so your shorelines might very well be even more off in many places - especially at relatively flat areas and/or shallow water.
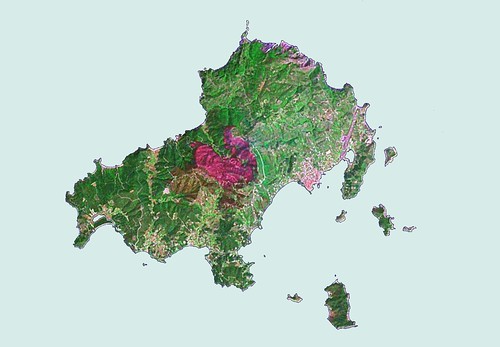
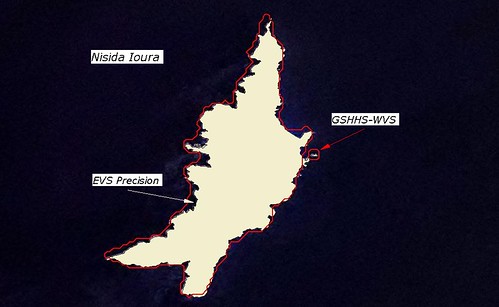
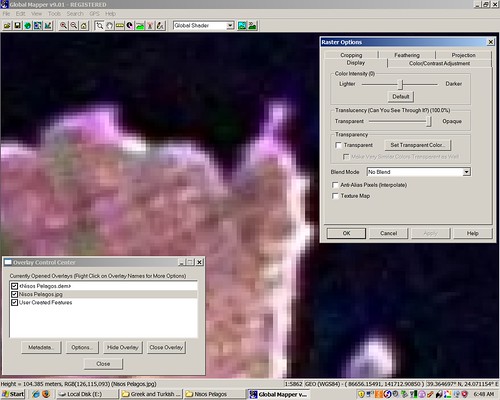
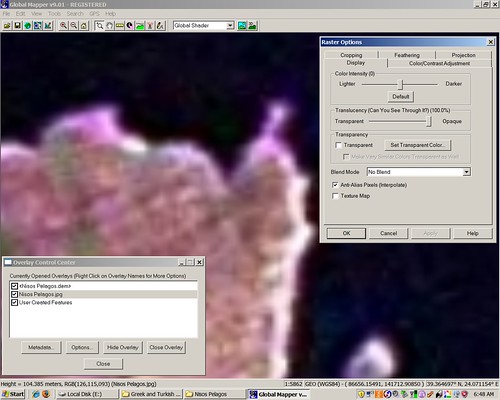
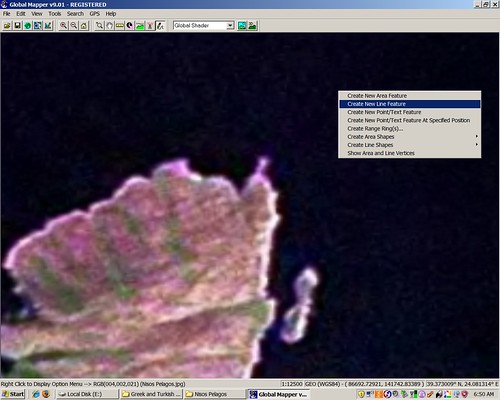
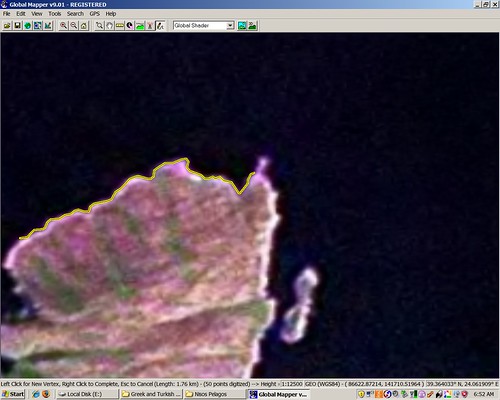
My response:Anonymous, your observation concerning the use of stereoplotting and surface models providing an accurate approximation of a dynamic shoreline are well taken. If one had the imagery depicting the shoreline at various stages of tidal fluctuations during a set period of time, the methods you refer to would always provide the superior shoreline representation. However, after monoplotting 1,000s of kilometers of shorelines and comparing my EVS precision shorelines to NGA PGS precision shorelines - EVS shorelines track the Landsat ETM+ imaged shorelines more consistently then NGA PGS precision shorelines. My guess is that their method introduced unanticipated stutters, inconsistent shoreline identification and non-inclusion of water inundated areas.
EVS precison is not perfect, just better at tracking the visible shoreline more consistently then NGA PGS.