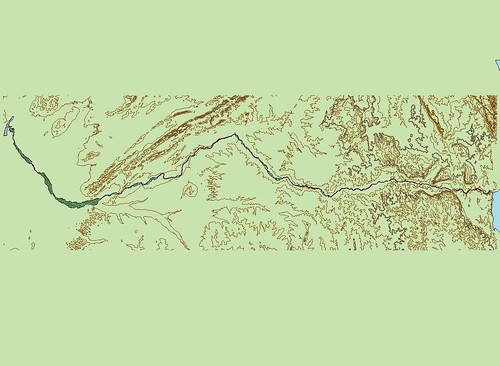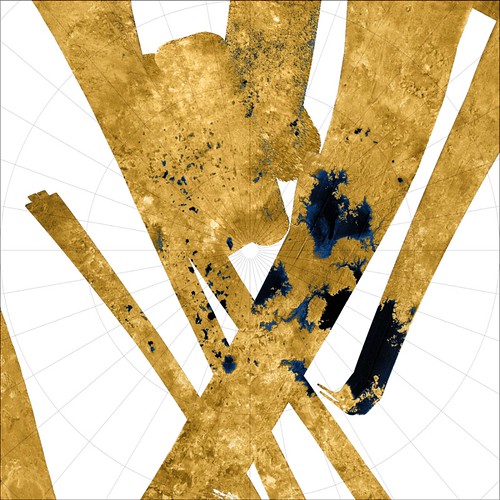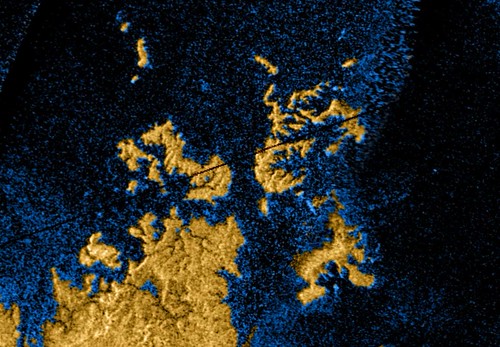
Cook Islands - Landsat ETM+ Coverage
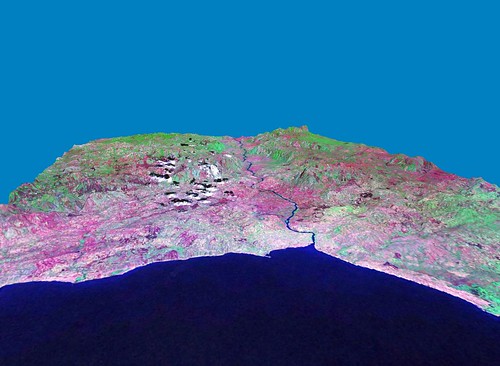
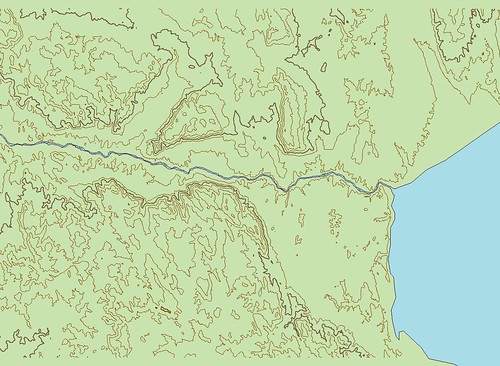
I have been very busy digitizing islands. In fact, I have just completed digitizing over 3,000 large and small islands making up the western portion of the Solomon Islands. I'm currently digitizing island shorelines in Papua New Guinea. All of this work is being done at EVS precision - using Landsat ETM+ base imagery and digitizing shorelines at a scale between 1:25,000 up to 1:50,000. Some of you have reminded me that because Landsat ETM+ is typically 14.5-meter resolution that digitizing at the scale I work at is overkill. After spending close to 3-years working with 14.5-meter resolution imagery, the maps I am able to produce work quite well. I wouldn't want to sail into a lagoon using only ETM+ imagery, but I could do excellent advance planning and rough navigation using maps derived from this imagery. I know my maps are often far superior in shoreline validity when compared to some of the very old nautical charts still in use today.
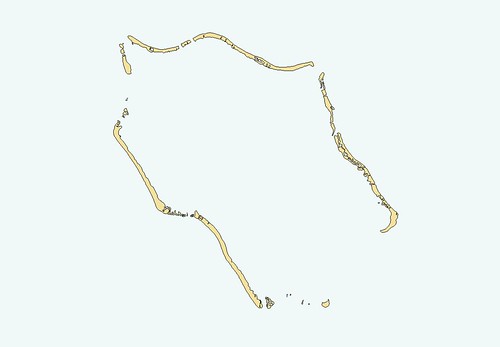
Anyway, this is supposed to be about green dots on a deep black sea. In between work on the Solomons and Papua New Guinea, I completed EVS precision mapping of the Cook Islands. The first image in this post struck me. It took seven Landsat ETM+ mosaics to cover the Cook Islands. If you study the above image at full size, almost all of these very small islands are impossible to see. Yet, they enable countries, like New Zealand, to claims (EEZ) enormous chunks of liquid real estate. These very small islands play a significant role in the distribution of world resources. Interesting.
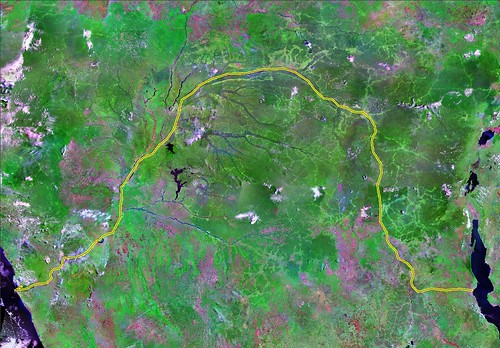
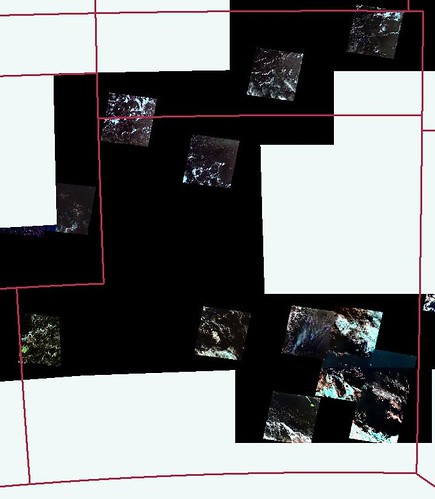
Cook Islands - Marplot Map with 25-km Ocean Masks
The Marplot map of the Cook Islands shows their distribution more clearly. They are scattered about within a peculiarly shaped border, that is if one finds rectangles peculiar. Actually, their EEZs would spill outside of their international border. I'm not sure if the border serves to limit their 200-NM EEZs. If that is the case, too bad for New Zealand and the Cook islanders.
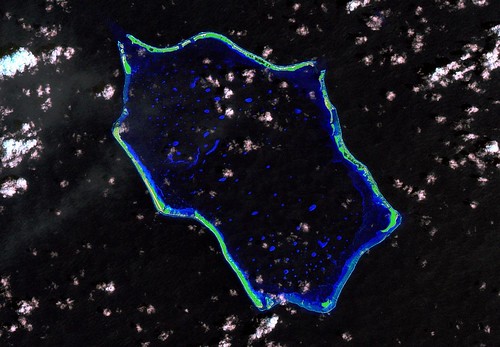
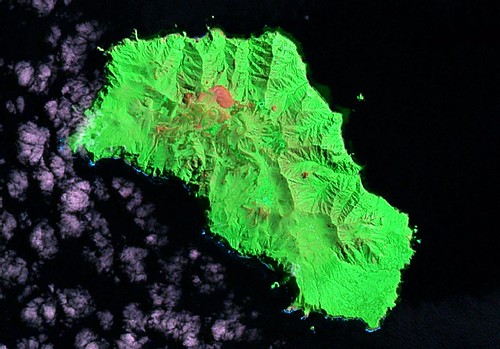
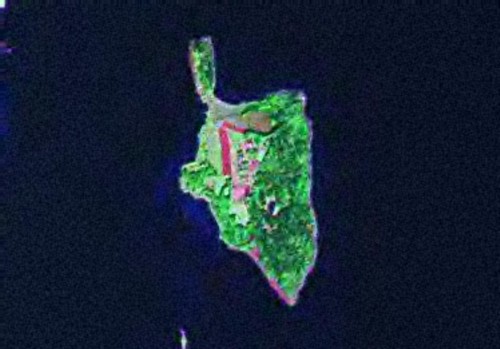
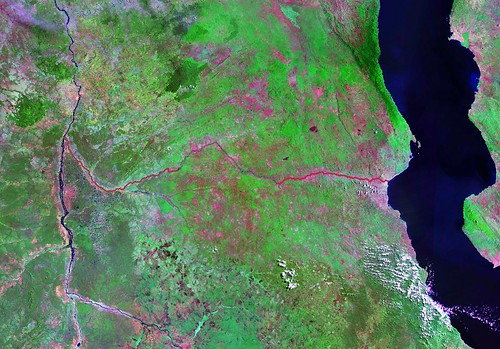
Penrhyn Atoll CW - Landsat S-04-05_2000 Image (1:125,000)
Just to confirm that there are islands located in this broad expanse of black ocean, here is one of them, Penrhyn Atoll. It has a classic atoll shape with a lagoon full of near surface coral heads. I have not researched Penrhyn as I was in a digitizing mode when I worked on it, not in an investigative one.
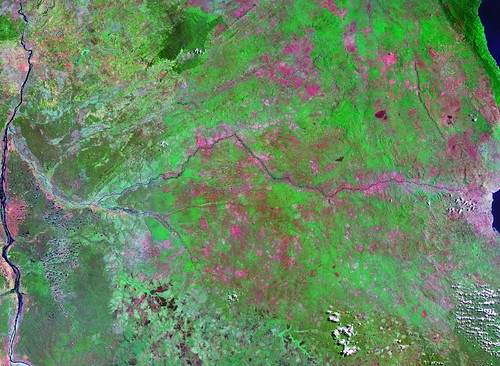
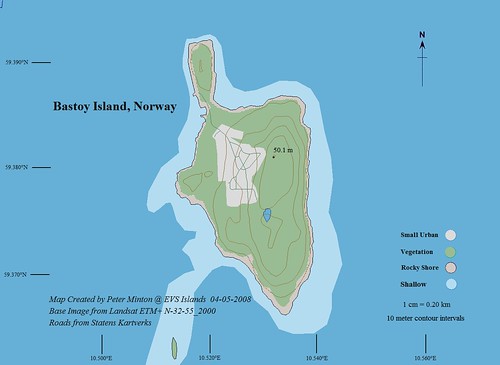
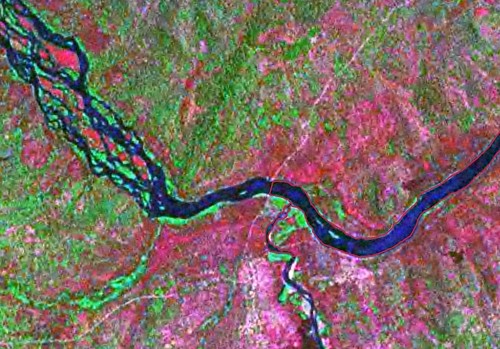
Penrhyn Atoll CW - EVS Precison Island Polygon Map (1:125,000)
This is my EVS precision map of Penrhyn Atoll. It is a solid shoreline depiction. My customary mapping effort of an atoll would include a number of additional layers of information - reefs, beaches, vegetation. As my client requires only shorelines, I digitizied and mapped the island's above-water shoreline and portion of it's awash reef. Again, it is a solid shoreline mapping effort and one that I will revisit to complete the other layers of information I would typically map.
I am still here, just not able to post as often as I would like. When I finish my paying mapping project (Whoopee!), I will share many, many, many more islands. Until then...
Enjoy!