Tuesday, August 26, 2008

Anaa Atoll FP - Many Motus Surrounding a Shallow Lagoon

Anaa Atoll FP - Landsat ETM+ Image S-06-15_2000 (1-125,000)

Anaa Atoll FP - Landsat ETM+ Image S-06-15_2000 (1:125,000)


Anaa Atoll FP - ISS006-E-34723 & 34724 Image (1-125,000)

Anaa Atoll FP - ISS006-E-34723 and 34724 Image (1:125,000)

Prior to beginning an EVS precision island mapping project, I scout for ISS imagery, especially ISS-006 imagery. Some excellent cloud-free images were captured during this mission. In the case of Anaa Atoll, Landsat ETM+ had some cloud issues. I downloaded, combined and georectified ISS imagery. Working with the Landsat image beneath the ISS image gave me excellent detail from which to create my finished EVS precision map.


Anaa Atoll FP - EVS Precision Map (1-125,000)

Anaa Atoll FP - EVS Precision Map (1:125,000)

For me, the most interesting feature on this map is the shallow lagoon. It has a few deep areas, but is overall shallow with most underwater features within it close to the surface. The atoll has a permanent population of 435 people (2002 census) scattered between a main village and a couple of smaller settlements. According to the Wikipedia article about Anaa Atoll, the soldiers that lived on Anaa were an especially viscious group. In 1769, James Cook was the first European to sight the atoll.

This mapping project took about three weeks to complete using an on-again, off-again pace. Seems my life has gotten complicated between preparing for the new school year, watching my grandchildren, completing "honey-do's" and squeezing in map work late at night.

Enjoy!

Tuesday, August 19, 2008

Comparison - MrSID, JPG, JPG2000, GeoTIFF 24-bit and GeoTIFF 8-bit

There are times I wish to work with Landsat ETM+ imagery with attention to file size. Instead of 80 MBs of raster imagery, I would like to work with 4 MBs. Using Global Mapper Raster Image Export feature, I am able to get the imagery I need easily. The raster format I typically use is JPG2000. Let me share why.


Raster Comparison (1-300,000)

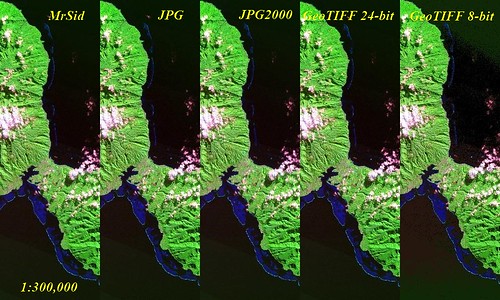
Raster Comparison (1:300,000)

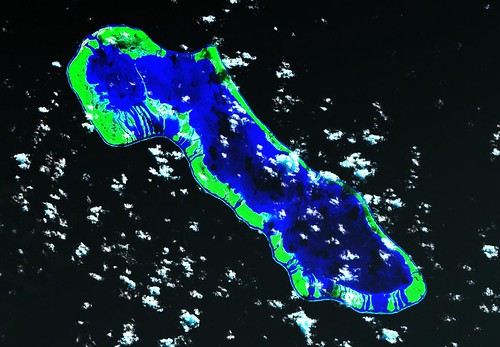
I did a comparison of different raster formats July 2007. My previous comparison was poorly constructed and explained. I always meant to redo it. So here it goes. The first composite shows a portion of a MrSID, JPG, JPG200, GeoTIFF 24-bit and GeoTIFF 8-bit. At 1:300,000 scale the images are visibly indistinguishable. One appears to be just as good as the other.


Raster Comparison (1-25,000)

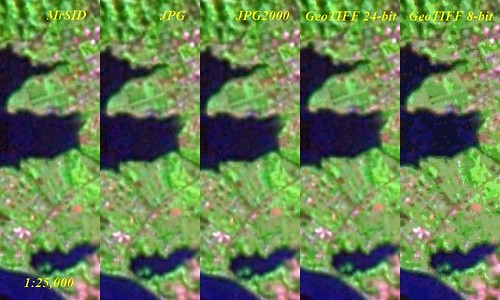
Raster Comparison (1:25,000)

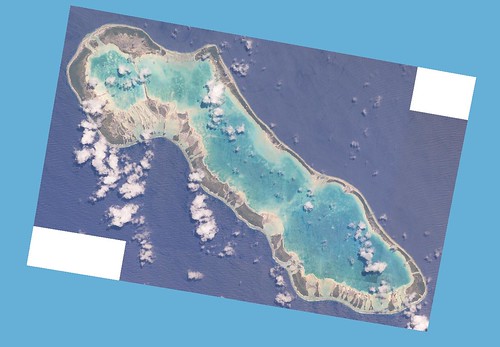
At 1:25,000 scale, which is pushing the limits of the original image (MrSID format), the first 4 images are very similar in clarity. The GeoTIFF 8-bit image begins to lose color depth, as one would expect from 8-bit imagery as it uses fewer colors in its color palette.


Raster Comparison (1-8,000)

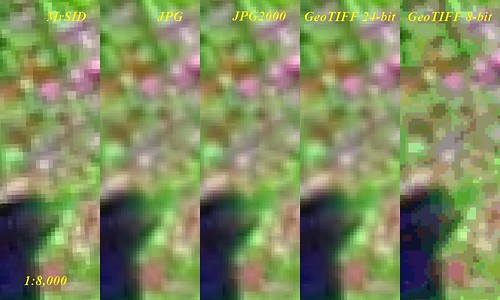
Raster Comparison (1:8,000)


Raster Comparison (1-2,000)

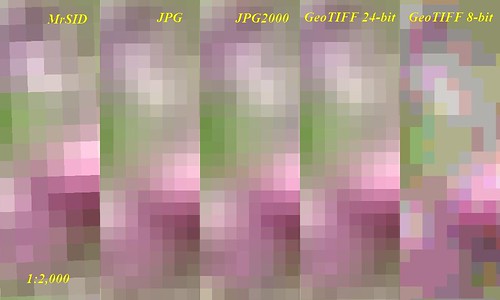
Raster Comparison (1:2,000)

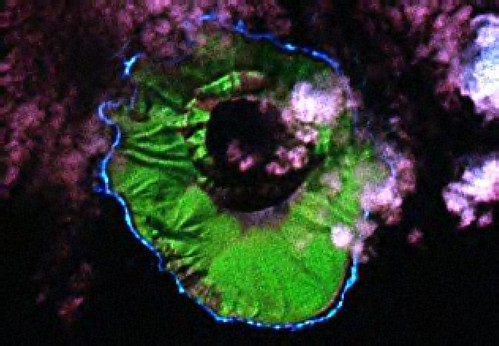
Finally, lets push the images far beyond their intended usefulness. The three middle images, JPG, JPG2000 and GeoTIFF 24-bit are noticeably superior to MrSID and GeoTIFF 8-bit at this scale. It is at the 1:2,000 scale that pixel size difference shows up. The three middle images all carry the same sized pixels and range of colors. The GeoTIFF 8-bit image has the same pixel size as the middle images, but without the rich variety of colors. The MrSID image, our base image, has a larger pixel size. Its color palette is used to form the colors found in all of the other images.

Now for the kicker - size and number of files: MrSID - 80.4 MBs and 2 files; JPG - 21.5 MBs and 3 files; JPG2000 - 4.5 MBs and 3 files; GeoTIFF 24-bits - 121.8 MBs and 1 file; GeoTIFF 8-bit - 10.4 MBs and 1 file. Clearly, the JPG2000 packs the greatest image bang for your MBs. However, I understand that JPG2000 is not widely used. If you are able to use it, do so as it gives you quality imagery in a compressed package. If you are not able to use JPG2000 format and you do not require working at 1:50,000 or lower, the GeoTIFF 8-bit works quite well. I happen to prefer JPG as my second choice after JPG2000. At twice the size of GeoTIFF 8-bit imagery, it is still a reasonably sized file to work with in lieu of MrSID. GeoTIFF 24-bits is far too large compared to the other three raster formats. Last, but not least is the MrSID format. It is my base imagery. The four other raster images were derived from my Landsat ETM+ image in MrSID format.

Hopefully, this raster comparison is both informative and helpful. If nothing else, the raster comparison images are pretty slick composites giving you side-by-side visible examples of these 5 popular raster formats.

Enjoy!

Saturday, August 16, 2008

Kasatochi Island - Site of an August 2008 Volcanic Eruption

Kasatochi Island - Landsat Image from N-01-50_2000 (1-16,820)

Kasatochi Island - Landsat Image from N-01-50_2000 (1:16,820)


Kasatochi Island - ASTER-Terra Image (ast_2003273) (1-16,820)

Kasatochi Island - ASTER-Terra Image AST_2003273 (1:16,820)


Kasatochi Island - EVS Precision Map (1-16,820)>

Kasatochi Island - EVS Precision Map (1:16,820)

I am an opportunistic island mapper. When I encounter an interesting island and it is mappable, I map it. So it goes with Kasatochi Island. Today's article in Earth Observatory Newsroom detailed the recent activities of Kasatochi Island. Located toward the western end of the Aleutians, this typically dormant volcanic island erupted on August 7, 2008. The eruption spewed out such a large amount of ash that Alaska Airlines cancelled 44 flights. The volcanic activity has continued and is being monitored daily by the Alaska Volcano Observatory (AVO). Follow the aforementioned link and it will give you all of the latest facts concerning this island's volcanic activity.

The Aster-Terra image is dated 09/23/2003, well before the current eruption. The Landsat image predates this by at least two years. I have no post eruption images, so all you get is a before map. The island is covered by vegetation, most probably low lying grasses. I am certain this eruption has refashioned the island's ground cover. At the bottom of the caldera was a small lake. It was probably vaporized in the eruption. When post eruption images become available, I will make a post eruption map to go with the above map.

Enjoy!

Thursday, August 14, 2008

Thoughts - My Progress at Mapping the Tuamotus

Tuamotus Progress

Tuamotu EVS Precision Mapping Progress

It has been nine days since my last post. What have I been doing? Keeping up with my summer duties - "honey do's", watching and entertaining my grandchildren (9 and 6 years) and mapping the Tuamotus. My goal this summer was to complete all 4 layers of EVS precision mapping for each of the 76 islands within the group - island polygon, vegetation, shallow reef and deep lagoon. To date 59 islands are complete. What exactly does that mean?

76 islands is not quite accurate. The Tuamotus are made up primarily of atolls. Each atoll has a number of islands, motus, to be exact. Just how many? A preliminary count puts the number of motus at approximately 5,640. Those are above water land. If the motu contains vegetation, I create a vegetation polygon. That means another 1,100 polygons to create (about 20% of the motus contain significant vegetation). Each atoll is surround by a shallow reef and an interior deep lagoon. However many of these interior lagoons are peppered with coral heads. If they show up on my base imagery, I map them. Probably another 2,000 polygons. All in all, I have to digitize 8,740 polygons, at least, to complete my summer project.

I have finished 59 atolls leaving me only 17 atolls to map. That is the good news. Now for the challenging news. Those 17 atolls will contain about 60% of the remaining polygons. All I have left to do is digitize another 5,240 polygons and I'll be finished.

If that seems like alot, it is. However, when this island group is mapped to EVS precision I will have accomplished my summer goal. It might be December 2008 before I complete my summer goal, but complete it I will. Wish me luck and...

Enjoy!

Tuesday, August 5, 2008

Tikehau Atoll FP - My Midnight Mapping Adventure

Tikehau Atoll - EVS Precision Map (1-150,000)

Tikehau Atoll - EVS Precision Map (1:150,000)

San Diego is hot and humid. A Mexican tropical storm is swirling up our way. We don't get rain, we only get hot and humid weather. So what did I do on this uncomfortable evening. I watched Sylvester Stallone in Rambo, First Blood and finished an island map. I had completed 1/3 of the atoll previously. This evening I completed the remainder of the map. At least the map, less the legend and all of those other necessary things that make a map a map. I will add the other necessaries later.

I was going to include some nifty Flickr photos of Tikehau Atoll. There are many gorgeous photos, but their distribution is restricted. If you want to see them, follow the above link. The photos are of the Tikehau Pearl Beach Hotel, classified as a 4-star hotel.

The resort is nice, but my map is better.

Enjoy!


Tikehau Atoll FP - The Morning After


Tikehau Atoll - Landsat ETM+ S-06-10_2000 and S-06-15_2000 (1-150,000)

Tikehau Atoll - Landsat ETM+ S-06-10_2000 and S-06-15_2000 (1:150,000)


Tikehau Atoll - EVS Precision Map (1-150,000) Finished

Tikehau Atoll - EVS Precision Map (1:150,000)

After resting for five hours, I had my morning cup of coffee, while working on my final Tikehau Atoll map. And here it is. I am working to make my presentation consistent. Consequently, my "fancy" work is done in ImageForge, MS Paint, Irfanview and Global Mapper. I use Times New Roman fonts with the island name in 16-pt bold, the credits and scale in 12-pt italic bold and the lat-lon labels in 10-pt bold. I use MS Paint for the lat-lon lines because it lets me draw a straight line. Finally, if I need to crop, resize or reformat a map, I use Irfanview.

Enjoy!

Friday, August 1, 2008

Oroluk Atoll FM - When This Old World Keeps Getting You Down...

Oroluk Atoll - Landsat Image N-56-05_2000 (1 cm = 1,500 meters)

Oroluk Atoll - Landsat Image N-56-05_2000 (1 cm = 1,500 meters)


Oroluk Atoll - DigitalGlobe Image From Google Earth (1 cm = 1,500 meters)

Oroluk Atoll - DigitalGlobe Image From Google Earth (1 cm = 1,500 meters)


Oroluk Atoll - EVS Precision Map (1 cm =  1,500 meters)

Oroluk Atoll - EVS Precision Map (1 cm = 1,500 meters)

Oroluk Atoll's nearest neighbors is 300 kilometers to either the east or west. If you want some alone time, this is your place. That is except for the eight to ten people tending banana and taro plants. I bet they would give you some space so that you might count the waves hitting the reef or the clouds in the sky. Or perhaps you might just "be".


Oroluk Atoll - From the Lagoon (AKK_319)

Oroluk Atoll - From the Lagoon (AKK_319)

This is what the only habitable motu looks like from the lagoon. It is flush with trees and surrounded by sandy beaches. Somewhere in the trees are a few houses.


Oroluk Atoll - Fisherman's Goods (AKK_3352)

Oroluk Atoll - Fisherman's Goods (AKK_3352)

Some of the dwellings are covered with palm fronds. When you get tired of bananas and taro, you could go fishing. I am sure that this lagoon abounds in fish.


Oroluk Atoll - Homestead (AKK_317)

Oroluk Atoll - Homestead (AKK_317)

Don't you just love this image - a home buried deep in a tropical forest. No mail, no cell phones, no radio, no tv, no vcr, no dvd, just you and 21 hectares of your quiet place.

Enjoy!