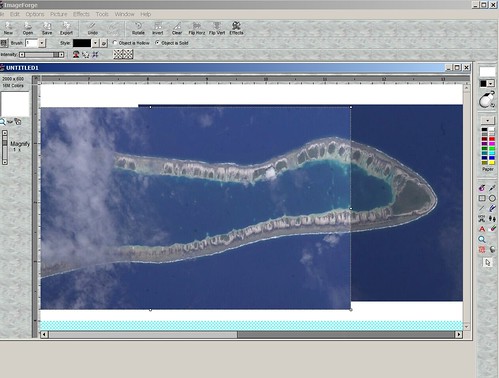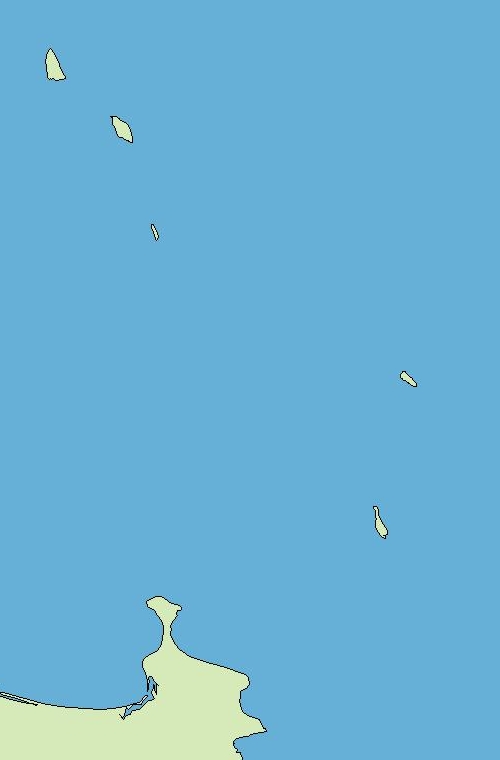
How To Map Reef Features - EVS Precision Map with Island Polygons (1:95,000)
During the month of May 2008, I digitized approximately 8,000 island polygons scattered throughout the southern Pacific Ocean. All of Papua New Guinea to the Cook Islands were mapped at EVS precision using Landsat ETM+ base imagery. And I got paid for my efforts! The above map is of a stretch of coast along the eastern shore of Bougainville, specifically approaches to Kieta and Anewa Bays. The customer purchasing the vector mapping wanted only shorelines as depicted on Landsat ETM+. All of my digitizing was at scales between 1:25,000 to 1:12,500, pushing the limits of Landsat ETM+.
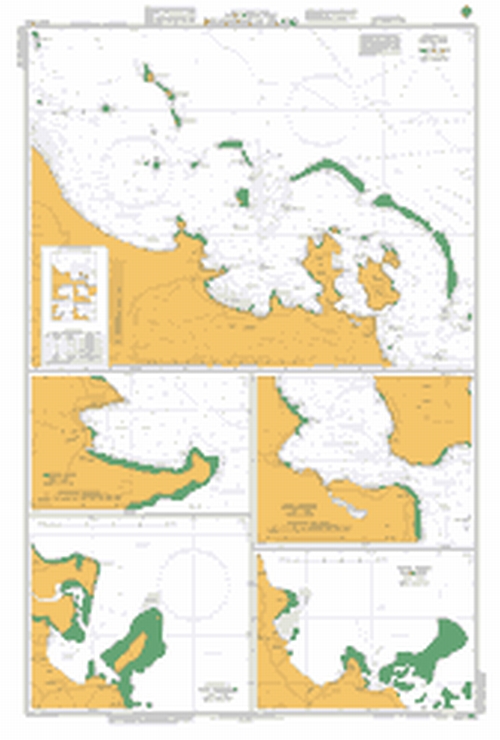
How To Map Reef Features - Aus 683 Nautical Chart
The above image is an enlargement of a thumbnail chart view provided by the Australian Hydrographic Service. It is intended to show you a rough depiction of the Kiela and Anewa Bays. Nautical charts have always been my inspiration for shoreline mapping. They typically minimize the on-shore details and focus, as you would expect, on the actual shoreline and off-shore features. I wondered if I could use Landsat ETM+ imagery to mirror Aus 683 reef details.
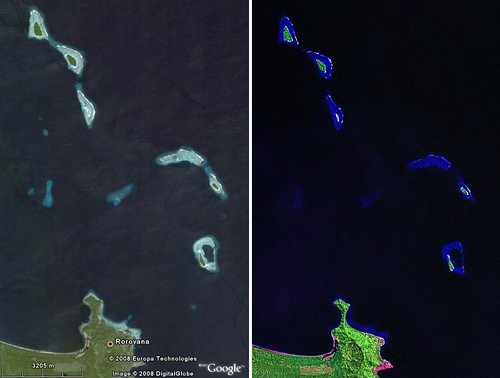
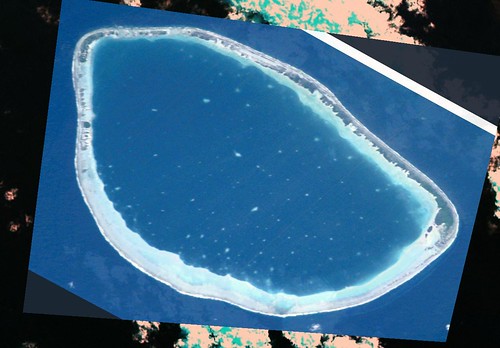
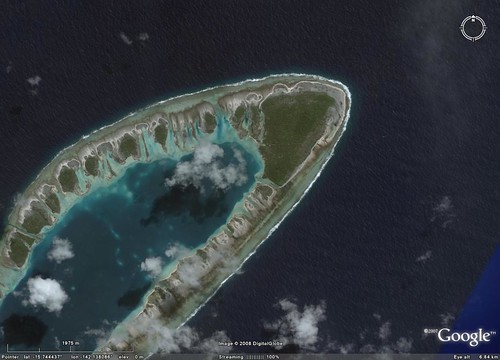
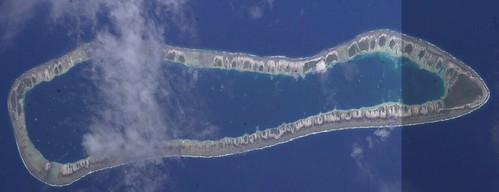
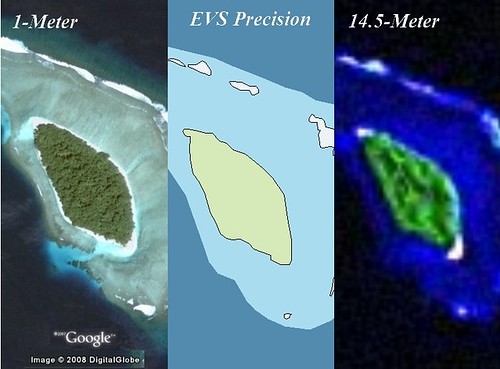
How To Map Reef Features - Landsat and DigitalGlobe Images (1:95,000)
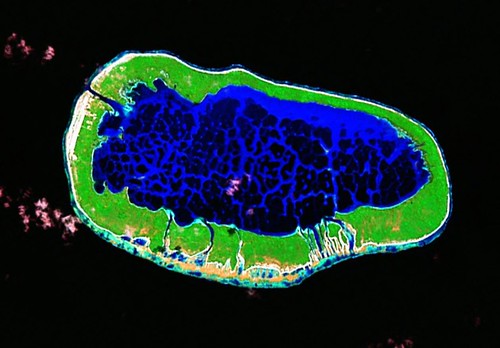
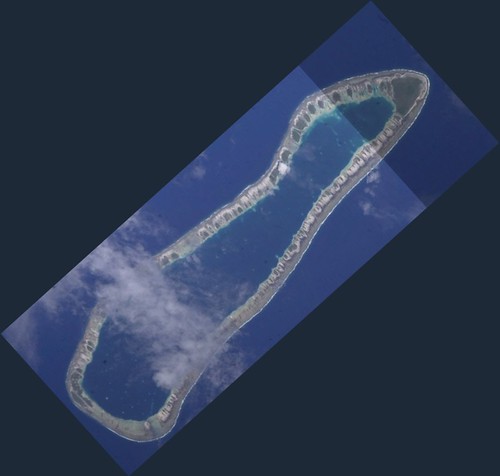
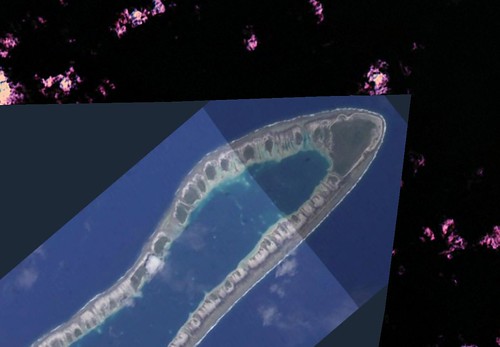
Landsat is not DigitalGlobe. 14.5-meter resolution compared to 1-meter resolution is Minnie Pearl compared to Angelina Jolie. However, if you really work with the "Minnie Pearl" resolution, one can create an accurate, within reason, and pretty good looking map.
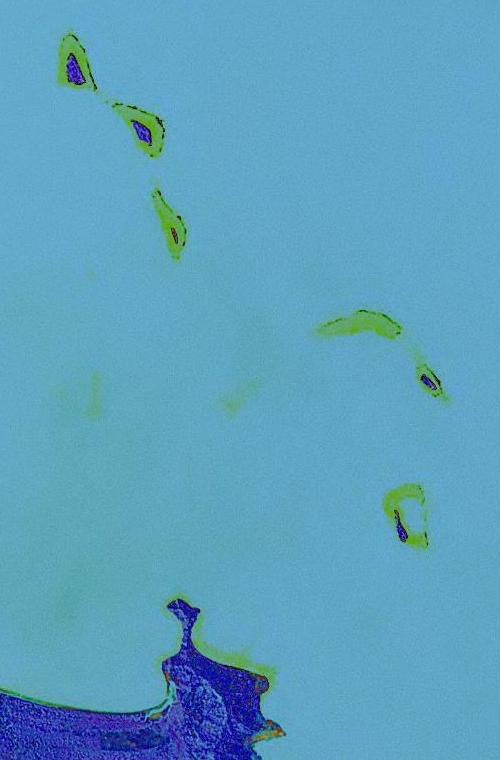
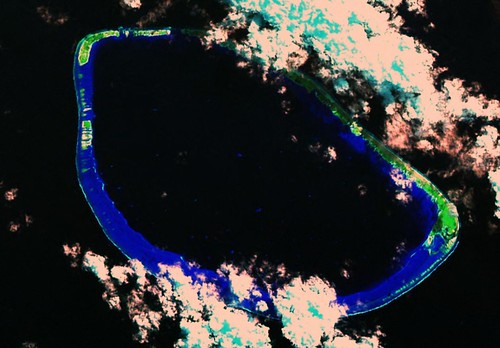
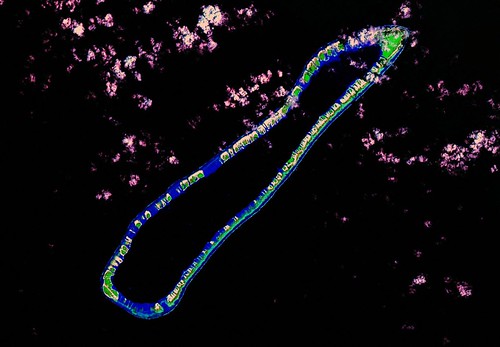
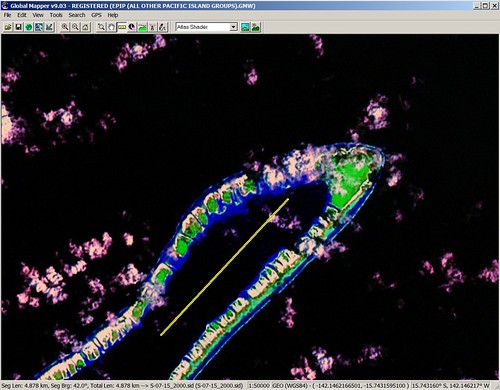
How To Map Reef Features - Landsat False Color Image (1:95,000)
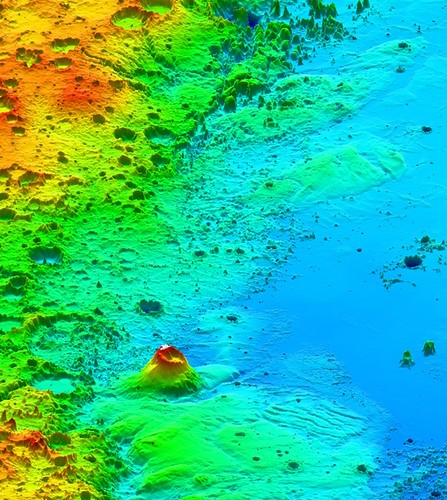
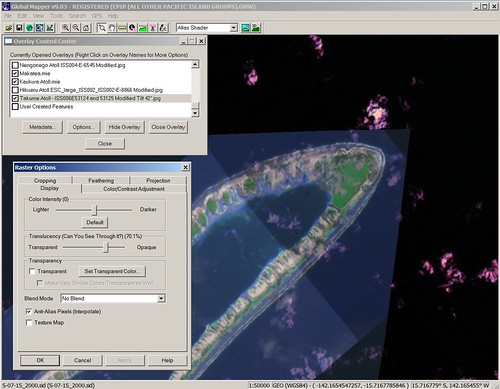
Having gained considerable experience at mapping reef features over the last few years, I've developed a reef mapping method. Using Global Mapper's image enhancement features, I trick my Landsat image using an enhancement called "Difference". It creates a consistent series of false colors causing reef features to display more clearly. Using a blue background, the reef features appear as sickly yellow colors.
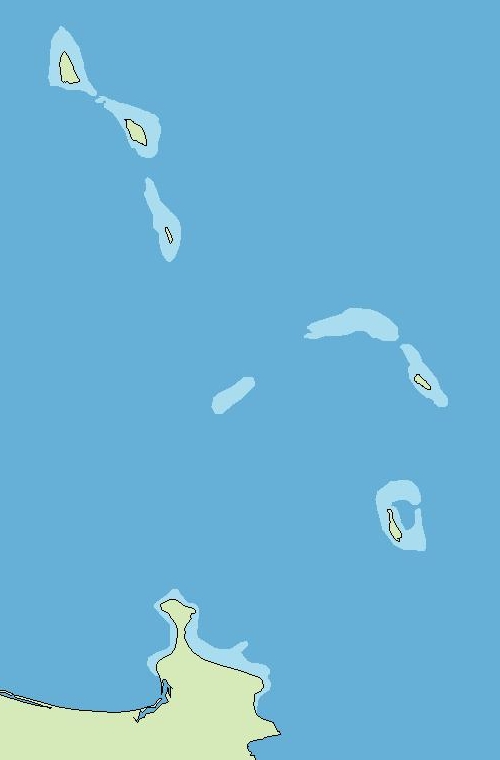
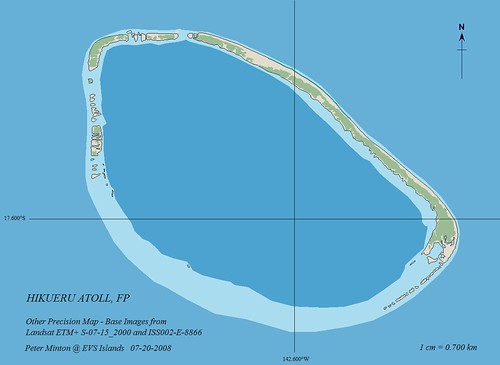
How To Map Reef Features - EVS Precision Map with Island Polygons and Reefs (1:95,000)
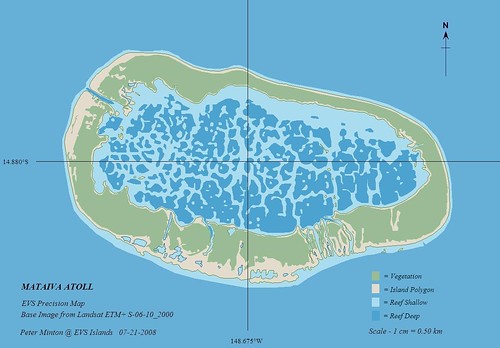
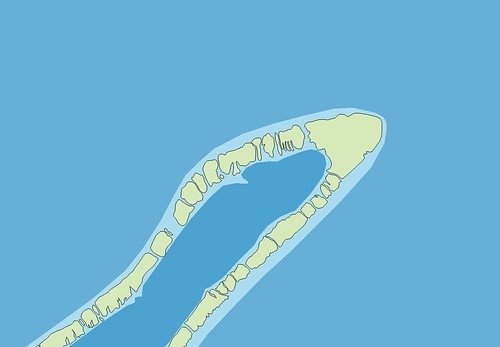
My first pass created reef polygons. I use a layer designation EVS Reef Shallow. Any yellow patch of color is identified as EVS Reef Shallow. I realize that one is able to extract a great deal of subtle reef information, given time. However, my goal is to try and emulate Aus 683's shorelines and reefs. The above map should be my finished product. It isn't.
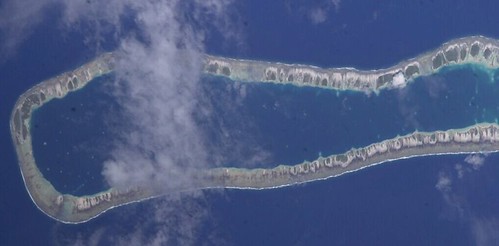
How To Map Reef Features - EVS Precision Map (1:95,000)
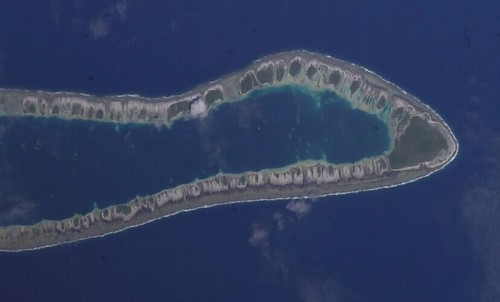
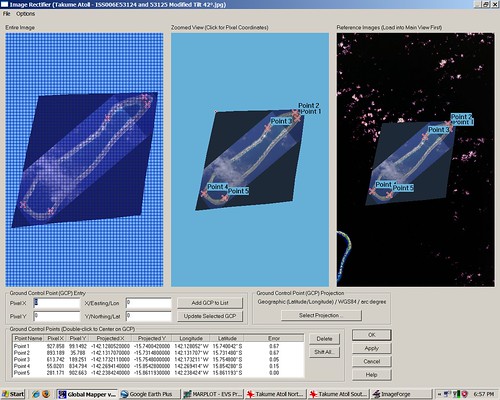
How To Map Reef Features - DigitalGlobe, EVS Precision and Landsat
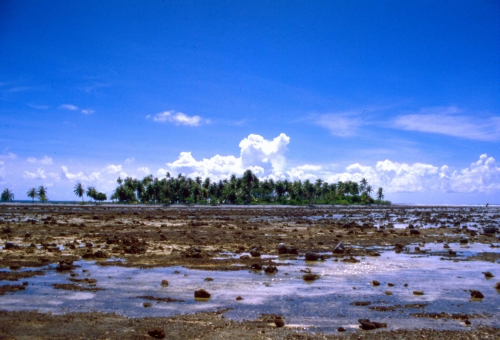
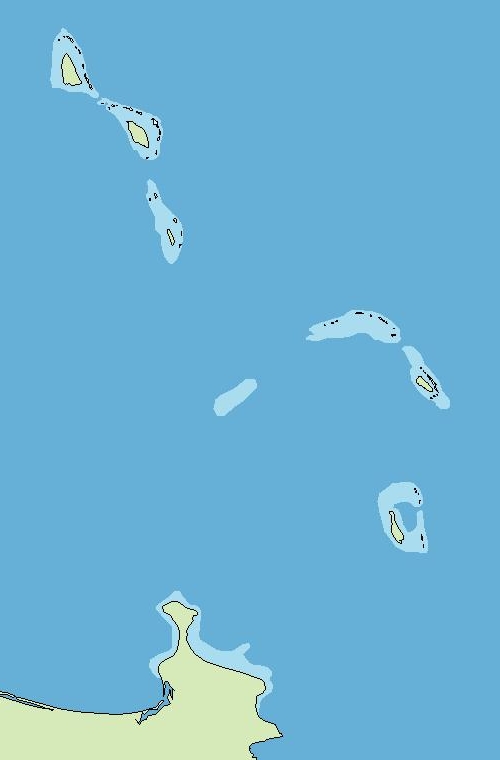
When one works at scales between 1:25,000 to 1:12,500 other reef features become visible, the white spots at the reef's edge, for instance. They could be sand bars, above water coral or waves. It turns out, when comparing 1-meter imagery of the same area, they are waves - turbulent white water sloshing across a reef shelf. I label these wave features as EVS Reef Awash. I define a reef awash feature as a visible feature typically at the reef's edge. Most often these features are waves. These breaking waves give a fairly consistent signature whether they are sliding across a reef or smacking against a continental shoreline.
My finished EVS precision map of this area now contain reef features - EVS Reef Shallow and EVS Reef Awash. I think they provide important information to all map users. And by the way, it turns out my EVS precision map of Bougainville is far superior to AHS's coverage. They have two charts covering this island. One at 1:300,000 (Aus 399) and the other covering five different areas along the east coast (Aus 683). My EVS precision map covers the entire island and outlying islands, with reefs, at scales between 1:125,000 to 1:50,000.
Enjoy!