If you have followed my posts you know that I do most of my mapping work in Global Mapper, a solid mapping program that is easy to use and handles very large format image files with ease (Landsat, SRTM, GeoTIFF). However, it costs real dollars. Big bucks for me and unaffordable bucks to outfit each student workstation with a mapping package. I have spent the last year learning how to make maps using Quantum GIS (QGIS), a well-maintained and powerful open-source mapping package.
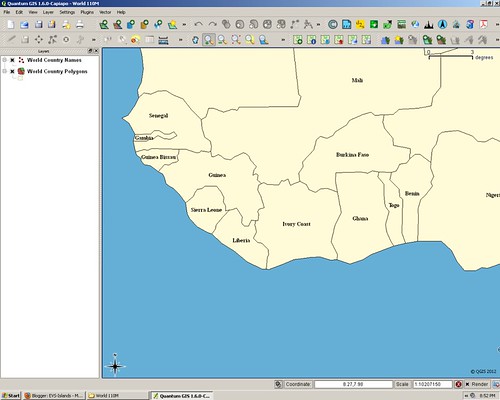
I teach middle school students between the ages of 11 to 14, social studies which includes world history, US history and geography. We spend a good deal of time working with open-source software (OpenOffice, Irfanview, Audacity, etc.) to learn about our world and how to make effective use of technology in the classroom. I have always wanted to bring mapping into the classroom. This year I decided to give QGIS a try with my students. I was determined to teach my students how to identify and display spatial data on a map. That brings me to the West Africa map and QGIS..
This year all of my students are learning to make maps. They have learned the difference between vector files and raster images. They are becoming adept at labeling countries, cities, empires and city-states. They love to use all the wrong colors and fonts, but I let them because they are having fun making maps. So far the projects have been relatively simple, but challenging in a mapping sort of way.
Today, my 6th graders (11-years old) were identifying and labeling countries in Africa using QGIS and a variety of vector files and a large format raster image of Africa taken from the Natural Earth website. They finished the country identification phase of the mapping project and wondered what to do next. I said, "Make a capital city point file and identify and label African country's capital cities." In the past, I would have labored long and hard to teach them how to make and use a point file. We would have spent a great deal of time setting up the symbology and label parameters. However, today within minutes all of the students created their capital city point file, defined parameters and were busy plotting capital cities. How cool is that!
Enjoy! I know I sure am!
No comments:
Post a Comment