Monday, October 22, 2007

Thoughts - Global Mapper, Mike and Excellent Customer Service

First about Global Mapper (GM) and why I use it. My work on islands is all about loading very large raster images (Landsat ETM+ mosaics). Each file is 100 to 300 MBs in size using MrSid format. Them is some big files! GM makes loading these very large files a snap. I select the file and it's loaded within seconds. I might add, properly georectified as well. Some of my projects require multiple Landsat images. No problem. I believe the largest file that can be handled by GM is up to 4 GBs.

Once I have the images loaded, I begin digitizing. Again, it's a snap. Digitizing in GM is precise and extremely flexible. After a brief learning curve, one is digitizing to their heart's content. Once the various layers of information have been created, the export choices are numerous.

Now my favorite part about the GM product - Mike. Mike is Global Mapper. I don't know if this is actually the case, but I visualize Mike working out of a small office. His phone isn't ringing, because he does all of his customer interaction via the web. He works daily with customers tweaking his excellent mapping program. Many times I read within the GM group that a customer wishes that something could be added, or a portion of the GM program adjusted, or a process simplified and most often within minutes to a few hours, Mike makes the change and posts the improved version of the program for all clients to retrieve. For this service, which is unparalleled in the industry, he charges nothing. He wants his product to be the best it can be and he knows that it is ultimately the end-user that is the best source from which to learn how to improve his program. If he can make the change, he makes it. If the change requires extensive programming, he makes the change more slowly, but he makes it. If the change is beyond his vision of what his program should be, he will provide you with a work-around or tell you straight that he isn't able to make the change. Mike does what every business should do - listen to the customer and respond quickly with a solution, not a promise of a solution, but a finished solution. Mike is the best!

I have other mapping software, but when I call them for answers, they want to charge me. If I work with them online, they give me happy talk about my question and they definitely do not make changes to their program in realtime. Most often, they tell me why something can't be done. Whereas, Mike just makes the change and provides the updated program to you.

All of you folks in charge of a product or service, LISTEN UP! Here is how Mike does his business and how you should - He reads your request. He answers your query. He adds to, changes or adjusts his program to satisfy your request. He makes the changed program available to his clients. All of this at no charge, and typically done the same day. And for his efforts, he has an extremely loyal and growing customer base.

That's good business! And that's why I continue to use GM.

Enjoy!


PS - GM is still my favorite mapping product for my type of projects and Mike is still the greatest when it comes to quality customer service.

Saturday, October 20, 2007

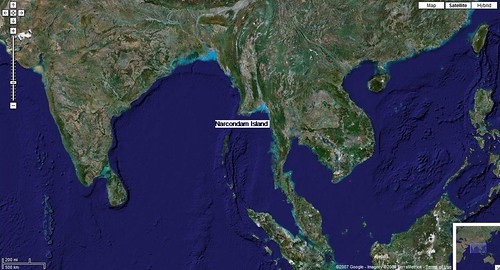
Narcondam Island IN - A Dormant Volcano Near the Andaman Islands

Narcondam Island - Google Locator Map

Narcondam Island IN - Google Locator Map

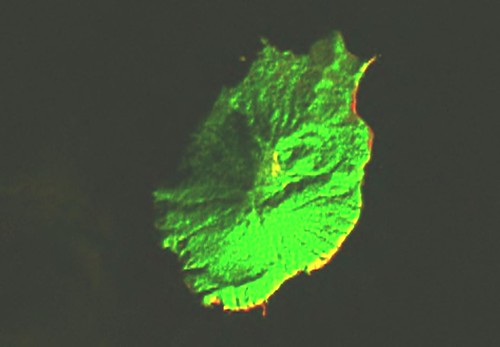
This small island 3km x 4km is a dormant volcano located 130km east of the Andaman Islands.


Narcondam Island - Landsat N-46-10 (1-25,000)

Narcondam Island - Landsat Image N-46-10 (1:25,000)

Initially, the Landsat image was very dark. The western shoreline was very difficult to discern. So the image has been lightened and the various band colors have been adjusted. Finally, the image was changed to a format called "difference" in Global Mapper. By doing this I could make out almost all of the western shoreline


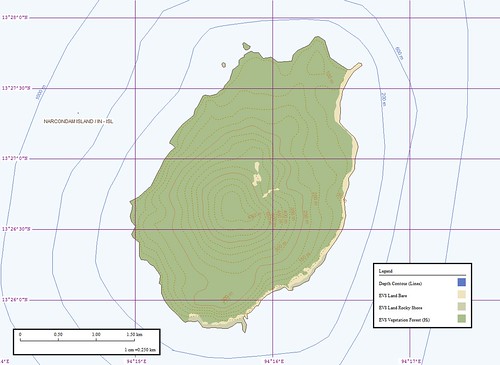
Narcondam Island - EVS Map  (1-25,000)

Narcondam Island - EVS Map (1:25,000)

This is the map I was able to create using the Landsat image as my base image. It is always a pleasure to map off of hi-res imagery, when available. Unfortunately, this small island does not have any readily available. I mapped the shorelines at a scale of 1:12,500. The entire map from beginning to end took about 3-hours. It is nice to complete an island map. It has been awhile.

Enjoy!

Tuesday, October 16, 2007

How To Realign Misaligned Contours Using the "Eye-Ball" Method

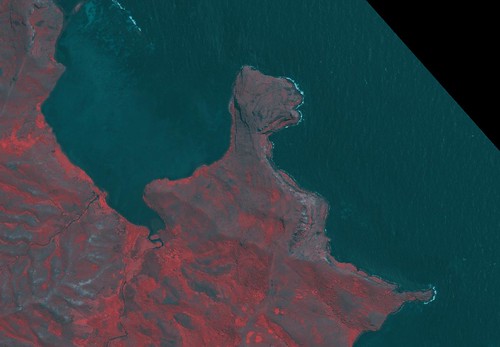
Rapa Iti - GeoTIFF Image (False Color) NE Coast Contours Redigitized (1-10,000)

Rapa Iti - NE Coast GeoTIFF Image False Color (1:10,000)

I have been working on a redo of Rapa Iti Island, using an exquisite, cloud-free GeoTIFF image, for the past month, an "on-again, off-again" project. I have completed the island's revised shorelines taking them from EVS precision to EEVS precision. That is from Enhanced Vector Shorelines using Landsat ETM+ base imagery to Extremely Enhanced Vector Shorelines using 1-meter resolution base imagery. The "zooming" capabilities of EEVS are pretty amazing. If you map it, one could zoom in to view your backyard which is in need of mowing.

Anyway, the revised Rapa Iti shoreline is finished. I still have a variety of vegetation layers to digitize, along with human ground signatures (dwellings, roads, paths, harbor features, etc). Before I tackled these challenging layers I thought I would quickly generate topographic contours. Using Global Mapper's "Generate Contours" routine, one merely needs to import the appropriate SRTM image for your area of interest, select a few options and one has contours generated in seconds. These contours, when SRTM is accurate and complete (no voids), accurately reflect the elevations of your target area. But, SRTM tiles often have little voids, which can be quickly filled using software tools (my personal favorite is SRTMFill) and in certain areas, big voids, which are difficult to reliably fill. After much thought, research and counting my money (I hate to spend money on pricey software), I decided to use a tried-and-true method "eye-ball-it". Any cartographer worth their salt cringes at this method. Too often, unscrupulous map-makers foist their finished product off as a rigorously crafted map following standard cartograph protocols, when, in fact, the map is more fiction than fact - none of which speaks kindly of the "eye-balling" method. However, since I do not have the means to obtain surveyed contour lines or modified SRTM data of my target island, I'll just "eye-ball" this portion of the project. This involves looking at the underlying land features and comparing them to accurate, reliable contours, guess-timating possible alignment of the various misaligned contour tracks (i.e., 20-meters, 40-meters, etc) and finally realigning them.


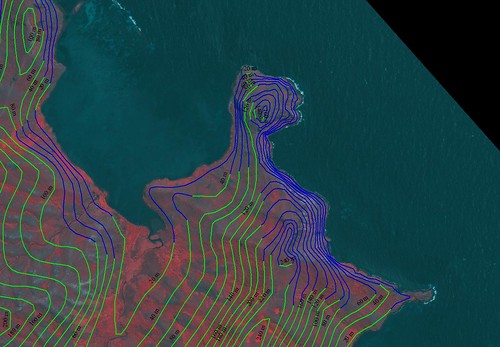
Rapa Iti - NE Coast Contours Redigitized (1-10,000)

Rapa Iti - NE Coast Misaligned Contours Realigned (1:10,000)

Let's begin with Maputu Pt or the NE Coast of Rapa. Because the SRTM data was incomplete, containing a large void (no data or incomplete data), this point had contours that were spilling into the ocean.


Rapa Iti - SRTM Base Image NE Coast Contours Redigitized (1-10,000)

Rapa Iti - NE Coast SRTM Base Image Misaligned Contours Realigned (1:10,000)

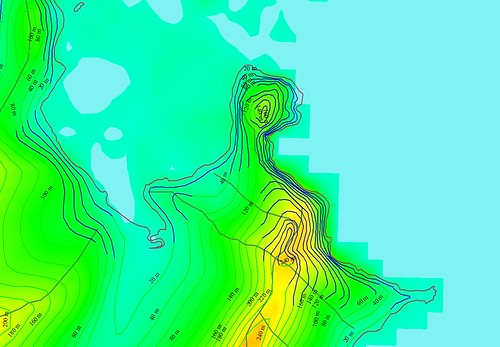
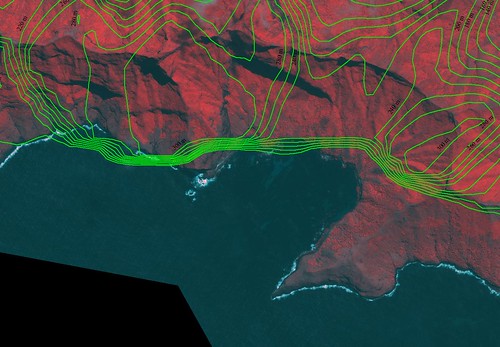
The above image shows the SRTM limits as a darker shade of green, when, in fact, the actual shoreline is west of the SRTM shoreline. Using the GeoTIFF image, I was able to realign the misaligned contours (see the blue contours). The method I used is "eye-balling". I looked at the shape of the easterm side of the point and beginning with the highest elevation, I realigned each contour level. The eastern side of Maputu Point appears to be quite steep, based on the GeoTIFF image and my contour realignments.


Rapa Iti - EEVS Map with Redigitized Contours Draped over SRTM Image with 3D Effect NE Coast (1-10,000)

Rapa Iti - NE Coast EEVS Map with Realigned Contours Draped over SRTM Image using GM's 3D Effect (1:10,000)

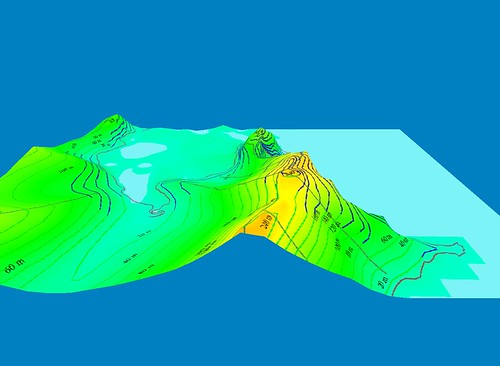
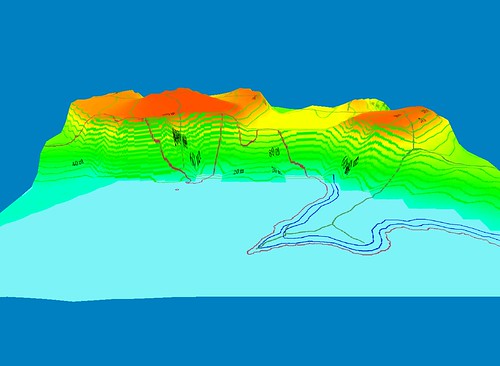
Using Global Mapper's 3D Effect, I was able to see my work in a different, more revealing way. I think my "eye-balling" of the misaligned contours works quite well.


Rapa Iti - GeoTIFF Image (False Color) NE Coast Contours Redigitized (1-10,000)

Rapa Iti - NE Coast GeoTIFF Image False Color (1:10,000)

From my GeoTIFF image to . . .


Rapa Iti - EEVS Map NE Coast Contours Redigitized (1-10,000)

Rapa Iti - NE Coast EEVS Map Misaligned Contours Realigned (1:10,000)

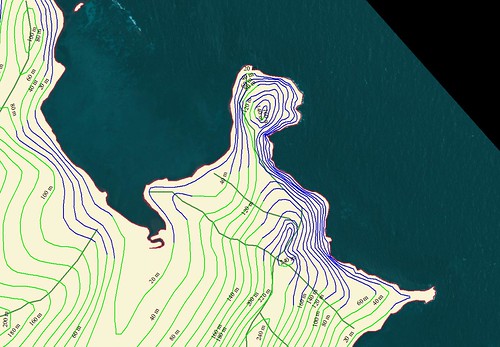
Rapa Island, Maputu Point using EEVS precision (hi-res imagery). The green contours are generated from SRTM data. The blue contours are my realigned contours. They track the elevations more accurately then the SRTM based contours.


Rapa Iti - GeoTIFF Image (False Color) S Coast Contours Misplotted (1-10,000)

Rapa Iti - S Coast GeoTIFF Image False Color (1:10,000)


Rapa Iti - S Coast Contours Misplotted (1-10,000)

Rapa Iti - S Coast Misaligned Contours (1:10,000)

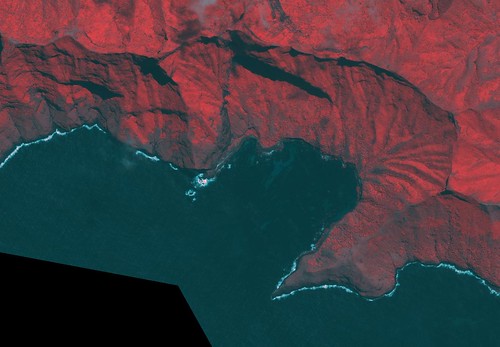
Along with the misaligned contours in the NE, another area of misaligned contours is along the southern shore. Looking at the GeoTIFF image without contours, one sees a coastline fronted by some pretty steep south facing slopes. Looking at the contours generated from the SRTM data, it is very easy to locate the problem contours. The steep slope is either poorly defined or nondefined by contours. Based on SRTM data, it appears the immediate shoreline is a very steep cliff fronting the shore. The contours do nothing toward resolving the remainder of the slope. Also the point that extends out is not defined.


Rapa Iti - EEVS Map Misaligned Contours Draped over SRTM Image with 3D Effect S Coast (1-10,000)

Rapa Iti - S Coast EEVS Map Misaligned Contours Draped over SRTM Image with 3D Effect (1:10,000)

Looking at the contours draped over the SRTM image the reason for the misalignment is obvious. Where there should be elevation data there is none.

So I will carefully "eye-ball" the slope and assigned contours where I guess-timate they belong. You know and I know these realigned contours are nothing more than educated guesses. In the case of this map of Rapa and in consideration of the quality of the base GeoTIFF imagery, the educated guesses will ultimately lead to a good map that is useful to gather an understanding of the topography of this island. If I were to have actual contours that could be applied to this map, I could produce a high quality product useful for a wide variety of purposes. As it is, my map containing "eye-balled" contours will be a quality product useful for a variety of purposes.

Stay tuned. This project should be finished within the next few weeks. Then, you be the judge.

Enjoy!

Tuesday, October 9, 2007

Jabal al-Tayr YM - One More Time

Jabal al Tayr

Jabal al Tayr - ASTER Image

This image is the latest post on one of my favorite websites - EO Newsroom. This site is always good for informative and interesting images, typically accompanied by well-written articles. If you've never visited, visit - it is worth the time.

I am including this ASTER image of Jabal al-Tayr. It is a closeup of the volcano that erupted September 30th. The image used in my previous post, Jabal al-Tayr YM, was extracted from a circa 2000 Landsat mosaic. This one, at 15-meter resolution, is clearer than Landsat. Fortunately, my original map is still a high quality rendering of the island shoreline and it's contours.

Enjoy!

Monday, October 8, 2007

Comparison - Pictobrowser vs. Traditional Flickr Slideshow


Takaroa Atoll - Finding Hidden Reefs Using The Color Dodge Effect Using Pictobrowser


Takaroa Atoll - Finding Hidden Reefs Using The Color Dodge Effect Using traditional Flickr slideshow (TFS)

First some facts - Both of these image viewing methods require Flickr. You will need to spend alittle money and get the Flickr upgrade account ($19 a year); both methods require that you insert HTML code into your Blogger post; they both generate the code required; PictoBrowser generates the code in just a few simple steps and then you cut and paste it into your new post, TFS is a cut and paste operation - cut an old entry, paste it into your new post and insert your Flickr Slideshow ID code (ID code for the above 72157594447232890) into the appropriate spot within your post; Pictobrowser requires a minimum of 10-lines of HTML code, TFS requires 2-lines of HTML code; PictoBrowser is not an automatic slideshow, TFS is an automatic slideshow; PictoBrowser includes image titles; TFS requires that you stop the show and select the slide to see the titles; neither one allows for the inclusion of lengthy comments as part of the presentation

Okay, that's enought. I happen to like the look of Pictobrowser for my purposes. It is not that I want a slideshow, but I want to display a series of images that tell a story. On the other hand, the TFS is very easy to use and is a great viewing option.

It has been about a year since I first posted this comparison (12/30/06). I typically use Pictobrowser when I want to display multiple images. It is fast, clean looking and easy for the reader to use. If you would like to give Pictobrowser a try, assuming you have a Flickr account with images, select the INFO button and answer the questions, then cut and paste into your own new post on your own blog and enjoy your creation.

Enjoy!

Thursday, October 4, 2007

Comparison - Vectors to Raster or Mr Minton on the Scene

Zooming in Using Vectors

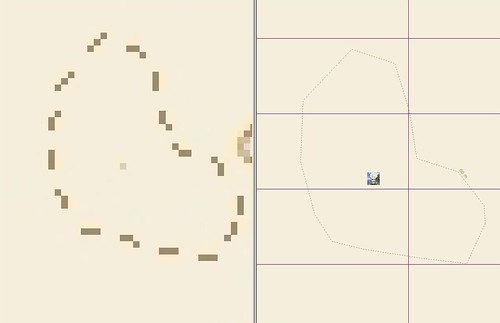
This post is aimed to all readers that are content to look at a picture (image) of a map and never enjoy the thrill of a good vector zoom. When I first began using maps, I was a picture user. Never having been exposed to vectors and their inate characteristic of zooming to amazing levels of detail. I know that the levels of detail are only as good as the original map maker can construct them, but given the right map maker one can discover amazing features tucked away within a vector map. Such as my map of Jabal al-Tayr. Who would have imaged that Mr Minton, yours truly, had his avatar perched on the northwestern plateau of Jabal al-Tayr. I'm sure he is safe, even after the volcanic eruption of a few days ago. He is writing this post after all.

Seriously, the ability to add levels of detail to maps is outstanding in today's world of readily available hi-res digital imagery compliments of Landsat, Google Earth and DigitalGlobe.


Raster to Vector - Jabal al-Tayr at 1-cm : 1,562-m

Comparison of a Raster to Vector - Jabal al-Tayr at 1-cm : 1,562-m

So, all of you raster rookies, explore the exciting world of vectors. Once you've been there, you'll never want to go back to static rasters.

Enjoy!

Monday, October 1, 2007

Jabal al-Tayr YM - Red Sea Volcano

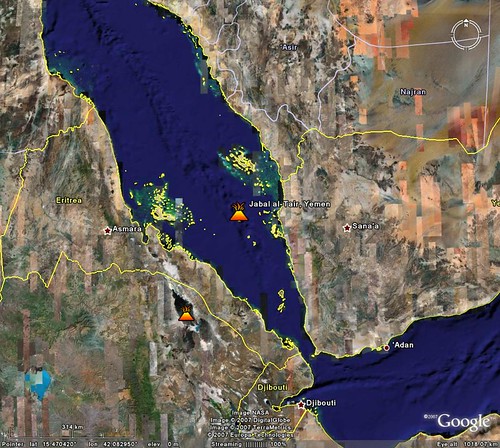
Jabal Al Tayr - Google Earth Image

Jabal al-Tayr Island Location from Google Earth


Jabal Al Tayr - Landsat Image N-37-15_2000 (1-25,000)

Jabal al-Tayr - Landsat Image N-37-15_2000 (1:25,000)


Jabal Al Tayr - EVS Map (1-25,000)

Jabal al-Tayr - EVS Map (1:25,000)

In the southern portion of the Red Sea at 15.54N 41.83E is this small island. If you didn't know where it's located and you are using Landsat to find it, it's very difficult to see. Using some image modifying features found in Global Mapper v9.0 the island shows up. It looks like there are clouds swirling off of the southeastern portion of the island. These clouds appear to be very dark and dusty, like volcanic ash. Well it turns out that this little round island is actually a very active volcano. According to a post in Google Earth Blog this little island's recent eruption led to the death of 8 Yemeni citizens. The post includes a KMZ file that includes the above posted Landsat image.

My EVS precision map of Jabal al-Tayr accents the island's simple shoreline. In addition, it
includes 20-meter elevation contours. I used Global Mapper's contour generation routine. One needs to import the appropriate SRTM, then generate your contours.


showmetabrowse.php

Jabal al-Tayr - DigitalGlobe Image (Non-obscured)


DigitalGlobe has a non-obscured image of the island, for a price ($400+) for those of you wanting to do additional research on this island.

The Red Sea is one of the world's critical ship transit channels and smack dab in the middle is this active volcano. If that doesn't beat all!

Enjoy!